
133: Context matters
Putting Q1 games into context and reviewing Carolina's lineup adjustments.

College basketball media and fans spend most of the season racing towards March. Now that we're only a day away, you're seeing blind résumés1 pop up and hearing the constant discussion about records in quadrants.
Over the past month, we’ve intentionally tried to avoid using the word "quadrant" in this newsletter. Last season, we covered why quadrants are arbitrary and can be misleading when evaluating teams.
This season, the NCAA took a positive step by adding wins-above-baseline (WAB) to the Team Sheets. Even though there is a better résumé metric available, the discourse remains fixated on quadrants. WAB doesn’t appear ready for the mainstream.
It's important to understand that despite what networks and bracketologists suggest, not all Quadrant 1 games are created equal. I partnered with Ryan Campbell, 5th Factor, to demonstrate this using WAB data.
First, let's clarify how the NET rankings define a Quadrant 1 game:
Home game against an opponent ranked between 1-30
Neutral game against an opponent ranked between 1-50
Away game against an opponent ranked between 1-75
Remember that NET is designed to be predictive. Without preseason ratings, rankings fluctuate throughout the season based on game results.
Let's examine three teams as examples: Gonzaga, Indiana, and North Carolina.
Gonzaga is 22-8 overall and ranked 8th in the latest NET rankings. In a few weeks, the Zags are looking to extend their NCAA Tournament appearance streak to 26 seasons.
Indiana sits at 17-11 overall and 57th in the latest NET rankings. The Hoosiers have already announced their current head coach will not return next season and remain under .500 in Big Ten play with an 8-9 record.
North Carolina was a preseason top-ten team, and UNC fans have growing anxiety about becoming an Indiana-like blue blood program that has fallen into mediocrity. The Tar Heels are 18-11 overall, 11-6 in ACC play, and 45th in the latest NET rankings.
If we assessed these teams using only records in Quadrant 1 games:
26.7 win percentage: Indiana (4-11)
25.0 win percentage: Gonzaga (2-6)
9.1 win percentage: North Carolina (1-10)
Based solely on this shallow analysis, one might conclude that Indiana is the stronger team due to their higher winning percentage in Quadrant 1 games. This would be a mistake.
Because context matters. When we analyze these Quadrant 1 games, comparing the difficulty of each matchup, we see a different picture.
The chart below compares the Quadrant 1 games for these three teams highlighting wins in green and losses in red, using shapes for the game location (circle for home games, triangles for away, and squares for neutral site games).
Each game is plotted based on the odds that a bubble team would win it. For example, a bubble team would have a 5.5 percent chance of winning at Duke, so you can see the triangle for North Carolina’s loss plotted at that percentage.

A bubble team would have greater than a 40 percent chance to win seven of Indiana's 15 Quadrant 1 games. Similarly, a bubble team would have a greater than 30 percent chance to win seven of Gonzaga's eight Quadrant 1 games.
North Carolina's Quadrant 1 schedule has been brutal. Their opponents in these games are stronger, with six matchups giving a typical bubble team less than a 25 percent chance of victory.
Of course, losing difficult games doesn't make you a good team or even deserving of an at-large bid to the NCAA Tournament. Wins matter, which is why WAB is so useful. Instead of arbitrary quadrants, WAB assigns a specific value to each result based on its difficulty.
In the current WAB rankings2, Gonzaga sits at 38th (1.20 WAB), ahead of both North Carolina (46th, 0.70 WAB) and Indiana (51st, 0.35 WAB), which aligns with their overall records.
While our team allegiance might be Carolina blue, we’re not suggesting Carolina is more deserving of an at-large bid than these other two teams at this moment3.
The beauty of a resume metric like WAB is its simplicity. You don't need to worry about getting another Q1 opportunity, avoiding a Q3 loss, or winning by a specific margin4 – you just need to win games.
Guard play
By Ryan / 5th Factor / https://5thfactor.substack.com/
Speaking of winning games, North Carolina is riding a four-game win streak. The Heels have found success through lineup adjustments.
After a narrow win over UCLA in December, former Villanova coach and current CBS Sports analyst Jay Wright suggested Carolina found something by playing with four guards. Wright may have been seeing similarities to his successful Villanova teams of the past.
However, Carolina doesn't have the personnel of those Villanova teams that featured Randy Foye, Kyle Lowry, Allan Ray, and Mike Nardi.
Contrary to Wright's assessment, UNC's 4-guard success against UCLA didn’t translate in ACC play. Seth Trimble was hurt in early January, which benched the 4-guard lineup, and upon his return UNC played all four guards together for at least 10 minutes in six straight games. The Heels were 2-4 in these six games, including résumé-flattening losses by a combined two points to Stanford (at home) and Wake Forest.
In UNC's last five games, the 4-guard look has been benched (again), this time in favor of a 2-guard look. These lineups typically feature Drake Powell at the 3 and the hot shooting Jae'Lyn Withers at the 4.
This plot shows game-by-game lineup usage over the entire season, broken down by lineups featuring 2-Guards, 3-Guards, or 4-Guards.

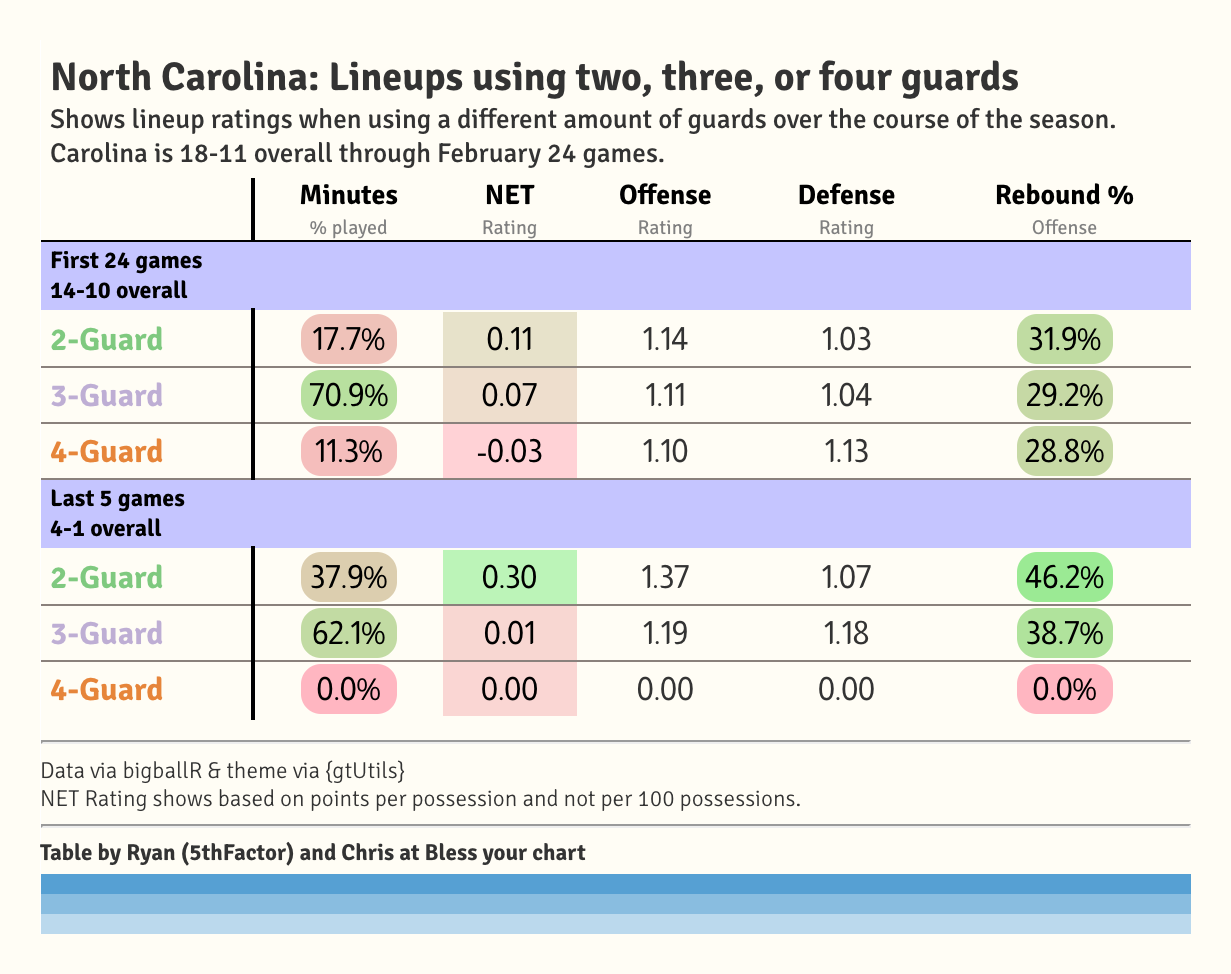
In the last five games these 2-guard lineups are operating with a +0.30 net rating, some of which is driven by Withers' three-point barrage (11-of-18 from behind the arc in those games).
Perhaps more sustainable or promising, the 2-Guard lineup is snagging offensive rebounds at near-vintage Carolina levels. Across five games, these lineup types are collecting 46 percent of their own misses, including 70 percent of misses in the win at Florida State (seven offensive boards on 10 misses in just 14 minutes of action).
In the short term, the hot shooting has driven up the 2-guard lineup's efficiency rating, but the offensive rebounding prowess indicates that the lineup could be more immune to a cold streak than the 4-guard look that Jay Wright favored.
Here is a comparison of the lineup usage from Carolina’s first 24 games and its last five games, showing the percentage of minutes played, NET ratings, and offensive rebound rates.
Selection Sunday is almost two weeks away and teams have little margin for error. Whether the committee embraces metrics like WAB remains to be seen, but one thing is clear—quadrant-based records leave out a lot of context.
The teams that win the right games at the right time will likely earn at-large bids, and Carolina is hoping its adjustments will pay off at the right time too.
Thanks for reading this far, and big thanks to Ryan (5th Factor) for his help with data, plots, and ideas for this post. If you’re looking for more college hoops data, check out this app with tons of details on WAB, conference standings, and more:
🤟 And please subscribe if you haven’t already done so, happy Friday 🤟
Comical how ESPN shows this graphic using only predictive metrics, and not actual résumé metrics like WAB.

This is using Torvik’s numbers as of today, and not the WAB on the Team Sheets. I’m also computing a WAB numbers on my own using Torvik’s numbers and attempting to align it there as a benchmark. This is too confusing, apologies.
Carolina’s loss at home to Stanford (-0.80 WAB) is more damaging to its résumé than any single loss that Indiana or Gonzaga has taken. Indiana’s win at Michigan State (0.82 WAB) is worth more WAB than the Heels best win (neutral at UCLA, 0.66 WAB) and Gonzaga’s best win (at Santa Clara, 0.65 WAB).
If the Heels want to make the tournament, they’ll need to keep winning games and probably figure out a way to beat Duke.
A 20-point win in 60 possessions is not the same as a 20-point win in 80 possessions (Houston is a good example).