The discourse around the NET has officially broken contain. Scott Van Pelt delivered his parting shot on SportsCenter1 with One Big Thing. Van Pelt’s address brought out a ton of debate from college basketball media.
I’ve written some in the past about how I think the problem with the NET is it tries to do too much. There is no raw rating or rating displayed at all. Only rankings.
This makes it easy to conflate the NET as a power rating and a résumé rating, which is not a good thing. Because power ratings are meant to be predictive and résumé ratings are descriptive.
I think the NET is meant to be more predictive than descriptive. This means the results (wins and losses) are not as important as how a team performed (efficiency).
If the wins and losses are not as relevant than why does every network that broadcasts college basketball games tout a record within a Quadrant?
Quad forbid
Wins-above-bubble or wins-above-baseline (WAB) is a résumé metric. This metric reflects how many more (or fewer) games a team has won against its schedule than a bubble-quality team would be expected to win against that same schedule.
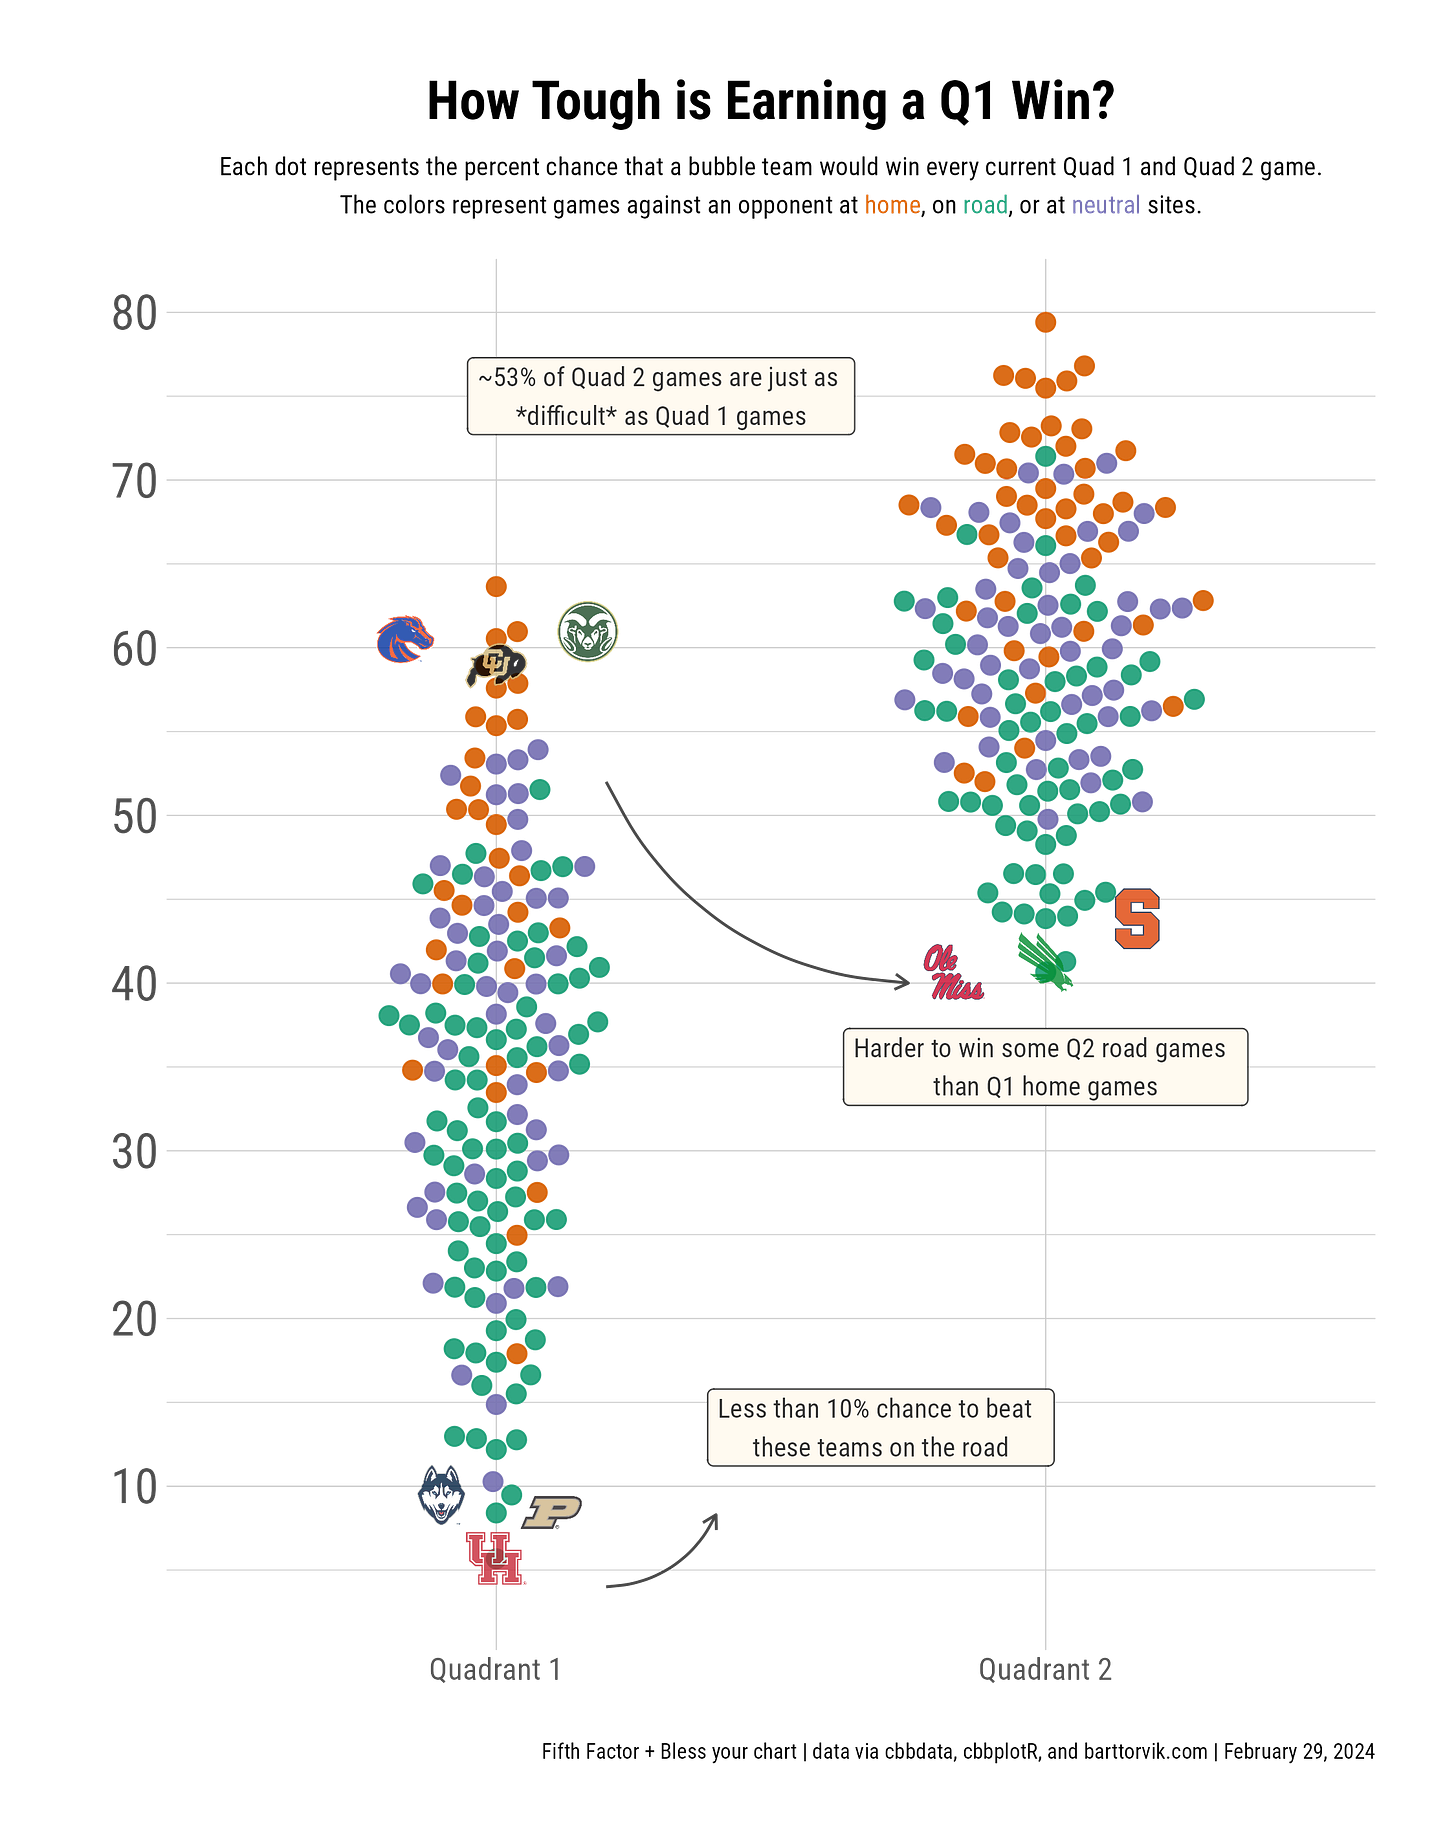
We can use a single game's contribution to WAB, the probability a bubble team would win that game, to shine a spotlight on the arbitrary nature of the Quadrant system.
For example, we can compare a bubble team's odds of beating Syracuse on the road (~44%) with a bubble team's odds of beating Boise State at home (~61%). Using these probabilities, a bubble team would be around a 3-point favorite at home against Boise State, but about a 2-point underdog on the road at Syracuse.
The problem is a road game at Syracuse falls in the second Quadrant and the home game against Boise State falls in the first Quadrant.
The Quad 2 game is harder than the Quad 1 game?
Ryan Campbell, @Fifth Factor, determined the odds that a bubble team would win games against opponents at home, on the road, or at neutral sites2.
The plot below shows the odds a bubble team would win every current Quad 1 and Quad 2 game. We then used that data to plot the difference in bubble odds between Quadrant 1 and Quadrant 2 games by location.
Using these odds, about 53 percent of Quadrant 2 games are just as difficult or more difficult than Quadrant 1 games.
For example, a bubble team would have about . .
a 58 percent chance to beat New Mexico at home (Quad 1)
a 41 percent chance to beat Ole Miss on the road (Quad 2)
Seth Davis3 believes what matters is the records versus the Quadrants.
If the NET wants to fully commit to being a predictive rating, a simple change would be to display the actual rating alongside the ranking. This is similar to any legit rating system, like a kenpom.com or barttorvik.com.
The distance between Wake Forest and St. John’s might be 10 spots in the rankings, but it’s helpful to know that rating might have a gap of less than two efficiency margin points.
You might be the salutatorian at your school, but what if the school only has 20 students and the valedictorian has perfect grades while you have a C average?4
When you force results into distinct categories, you end up losing information, especially when the information is ever changing.
We try to understand running water by catching it in a bucket.
You get the idea. Quadrants are arbitrary and a metric like WAB can point that out.
Of course, no metric is perfect. WAB has its own flaws5 too, but for fun, consider these three results all worth about the same WAB and all spread across three different quadrants:
+0.38 WAB: Pittsburgh’s 80-63 road win at West Virginia (Quad 3)
+0.39 WAB: BYU’s 95-86 neutral site win against NC State (Quad 2)
+0.39 WAB: New Mexico’s 68-66 home win against Colorado State (Quad 1)
Thanks for reading this far, and please subscribe if you haven’t already. Check out these two tools that may help you understand college hoops a bit better too:
CBB Conference Index: standings, head-to-head records, and percentage of games in each quadrant
WABStick: compare the résumés of two teams using wins-above-bubble
Van Pelt still brings in on SportsCenter. ESPN in general has really faded, but Van Pelt makes a great show. I grew up on SportsCenter and Kenny Mayne shouting “bring me all the finest meats and cheeses!” after a home run.
Team strength is determined using barttorvik.com via cbbdata and game odds calculated via log5.
If anyone tells you something is irrelevant, you should be skeptical.
Bad analogy? Probably. I had to google how to spell both salutatorian and valedictorian though, so please clap.
WAB doesn’t know how bad you might have a beat a Q4 opponent, only that you won. At least, WAB is explicit in its explanation. Because it’s only intended to be a résumé metric.


These have been awesome lately, and this may have been the best one yet. Hitting your stride on the cusp of March like all the greats before you!