


136: The Madness
NCAA tournament data and some thoughts on the maddening discourse.

The NCAA men’s basketball tournament is underway this week and we’re back to share some data.
Ryan Campbell, @5th_Factor, is using Bart Torvik’s data and the public data provided by Yahoo! to recommend which teams to pick in your bracket pool. These plots show the linear relationship between Yahoo! bracket picks and the true odds provided by Torvik as of Wednesday, March 19.

You can find leverage where the bracket pick percentage and true odds diverge.
For example, Torvik gives Michigan State around a 14 percent chance to advance to the Final Four, but 27 percent of the public has picked them to win the South Region.
Another team with potential value is Texas Tech. Torvik’s odds give the Red Raiders around an ~18 percent chance to make the Final Four yet only seven percent of the Yahoo! brackets have that pick.

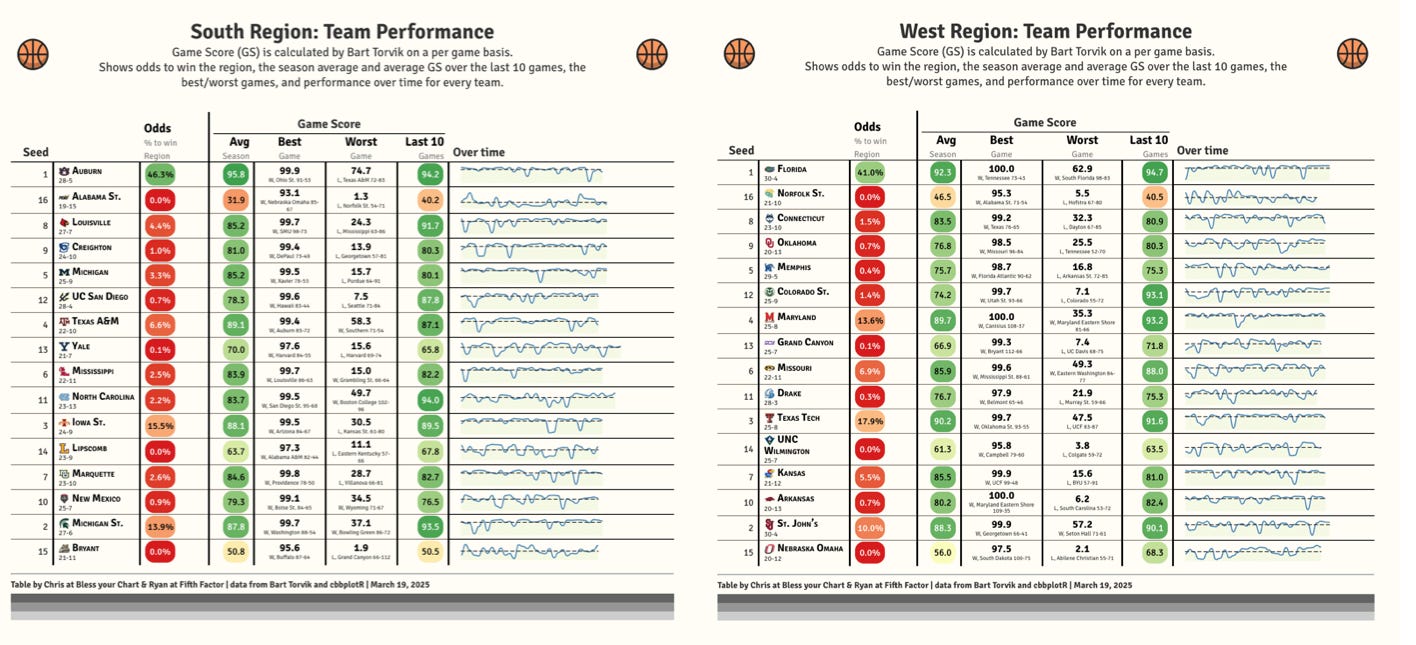
Game Scores by Region
Bart Torvik’s Game Score metric can be useful to understand the range of a team’s performances. It shows how consistent a team has been throughout the season and reveals trends in their performance.
Of course, no team is as good as their best game and as bad as their worst game, but you can get an idea of what’s possible for any given team in the field.
These tables contain a lot of information, so if you’re looking for more individual team data, check out this tiny app that surfaces the same data.

A Maddening Sunday
Last Sunday, I wrote about how we’re going to find out if the NCAA men’s basketball committee was going to use Wins-Above-Bubble (WAB) or not. And boy, did we find out. It was a major win for WAB and progress towards moving away from the reliance on quadrants.
The reaction to North Carolina receiving an at-large bid was a lot. It was labeled a miscarriage of justice, a crime, and the governor of West Virginia1 even held a press conference threatening legal action.
The biggest thing that stood out to me over the last few days is the amount of coverage of college basketball that is neither useful or entertaining. It’s useless.
Too many media personalities emphasize being right at the expense of being open.
If you’re open to learning more about WAB, check out Ryan Campbell’s useful graphic from a couple seasons ago. And here are a few other recommendations from people significantly smarter than me about the selection process, metrics, and quadrants:
John Gasaway: Replace the WAB-pilled committee with WAB
We don’t need metaphysics. This is sports. Amen.
Seth Burn is the creator of WAB. I’ve tried to champion his work and surface it more because it’s sound and smart. His other résumé metric, Parcells, might even be better than WAB.
Listen to Seth’s thoughts after the bracket reveal with Brian Bolek
Writing about the 2019 tournament and why UNC Greensboro deserved a bid
Another post about résumé and power ratings
Torvik wrote about quadrants and the 2022 Carolina team a couple seasons ago, and it’s another good example of what’s wrong with Quadrant 1 absolutism.
🤟 Thanks for reading this far, and check out this tiny app to look up more college basketball data from this season. 🤟
For the record, agree that West Virginia got hosed. In the data I tried to analyze last week, I didn’t even include the Mountaineers in any of the charts because I assumed they would receive a bid. I think Texas deserved a lot more scrutiny than any other team.