
135: The Weight
A few thoughts of how we measure teams on the morning of Selection Sunday.

Team sheets are used as the NCAA Division I Men's Basketball Committee meets to determine the 36 at-large bids and the seeds for all 68 teams in the NCAA tournament. It’s been described as a "visual snapshot" of a team's résumé.
Each team sheet contains 21 columns of data. A team’s games are categorized by opponent in four quadrants. There are 364 Division-I teams, so the quadrants attempt to divide up that many teams into tiers.
For example, beating Oregon (ranked 29th in NET) at home counts as a Quadrant 1 win, while beating VCU (ranked 31st) at home is a Quadrant 2 win. Even though these two teams are separated by just two ranking spots.
This season, the NCAA added WAB (Wins-Above-Bubble) to team sheets. WAB is a résumé metric showing how many more (or fewer) wins a team has against its schedule compared to what a bubble team would be expected to have against the same schedule.
The NET WAB metric uses the NET ranking as the basis for opponent strength, with the reference "bubble team" defined as one ranked 45th in NET. There are other résumé metrics available to the committee, however, WAB is featured prominently in the NET rankings.
What will the committee prioritize when evaluating teams?
There is more than one way to measure a team. And with a committee of 12 human beings, it’s tough to know what they’ll use to measure a given team.
My hope is the committee follows the recommendations of others and uses WAB or a true résumé metric to award at-large bids to the dance. Because the NCAA is relying on its proprietary NET rating1 to compute its WAB metric to determine at-large bids, we might soon find teams with better résumés overlooked in favor of those ranked higher in the NCAA's own system.
This brings us to Goodhart’s Law, or when a measure becomes a target, it ceases to be a good measure. I’ve written about this in the past, and this graphic sort of nails it2.
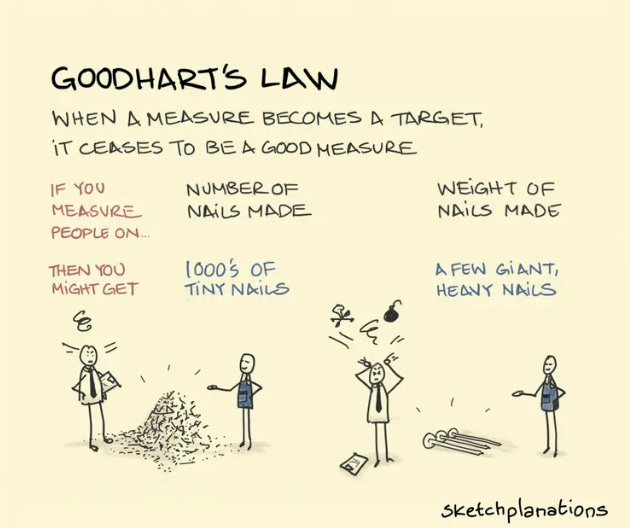
Quadrants measure the number of nails made (wins and losses)
WAB measures the weight of nails made (wins and losses)
What's more important when evaluating a team's performance against its schedule? I'd argue it's the weight of wins and losses, not just the count.
WAB assigns different credits (weights) to wins and losses rather than treating every game as equal within each quadrant.
WAB by Quadrant
Here is the WAB calculated using Bart Torvik’s ratings and segmented into each quadrant for six bubble teams on Selection Sunday. In the footnotes, find the difference in rankings between NET WAB and Torvik WAB of these teams3.
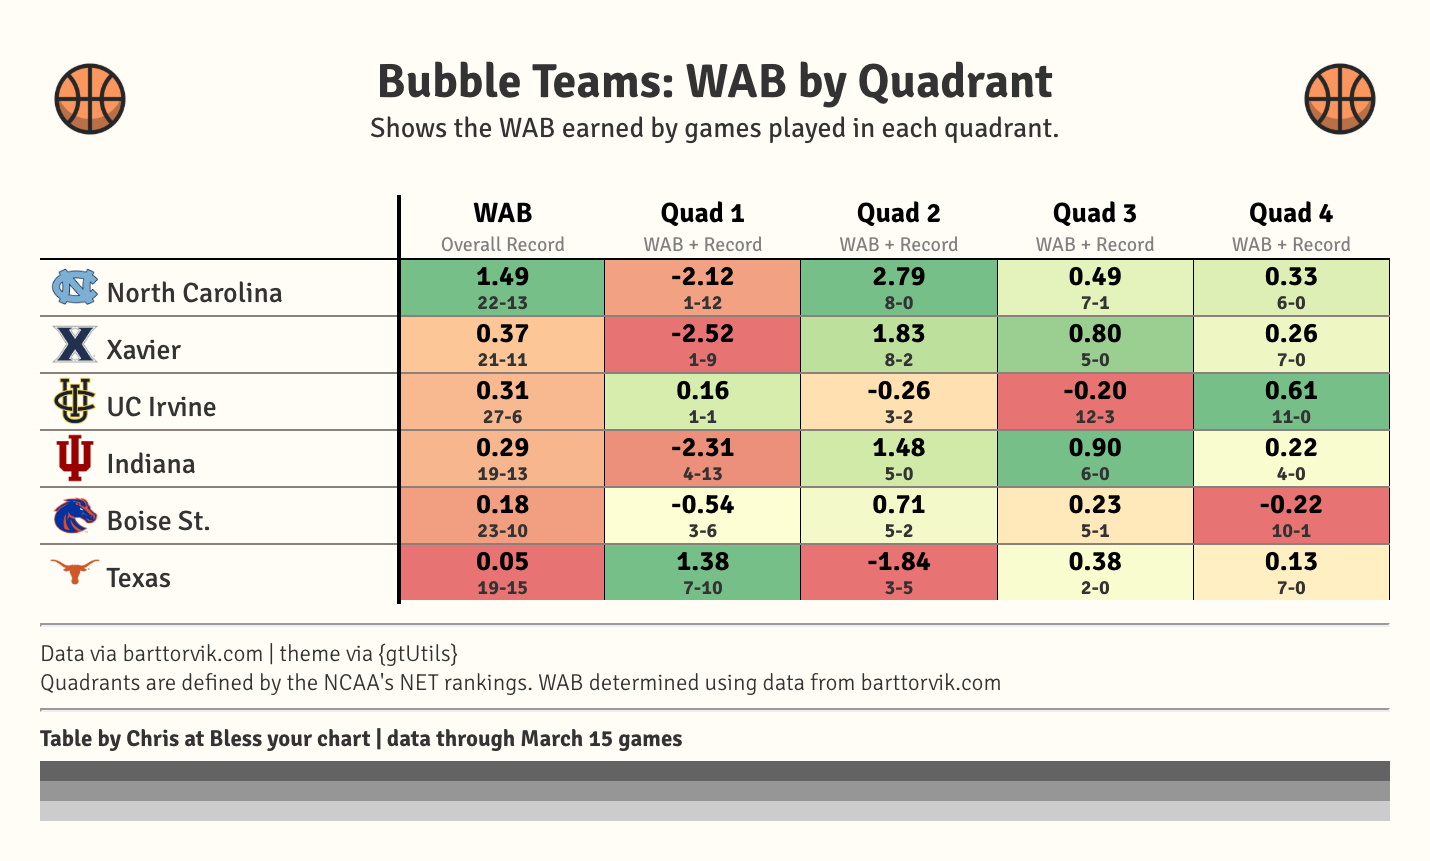
This comparison demonstrates why measuring the credit (weight) of wins and losses rather than just the volume can be so illuminating:
Texas vs. North Carolina: Texas has six more Quadrant 1 wins and two fewer Quadrant 1 losses than North Carolina4 (7-10 vs. 1-12 in Q1). And North Carolina has eight more Quadrant 2 wins and five fewer Quadrant 2 losses than Texas (8-0 vs. 3-5 in Q2). However, Texas has a cumulative -0.46 WAB in Quadrants 1 and 2, while North Carolina has +0.67 WAB.
UC Irvine vs. Boise State: The Anteaters have seven more Quadrant 3 wins than the Broncos, yet the Broncos' total WAB in Quadrant 3 is 0.43 higher.
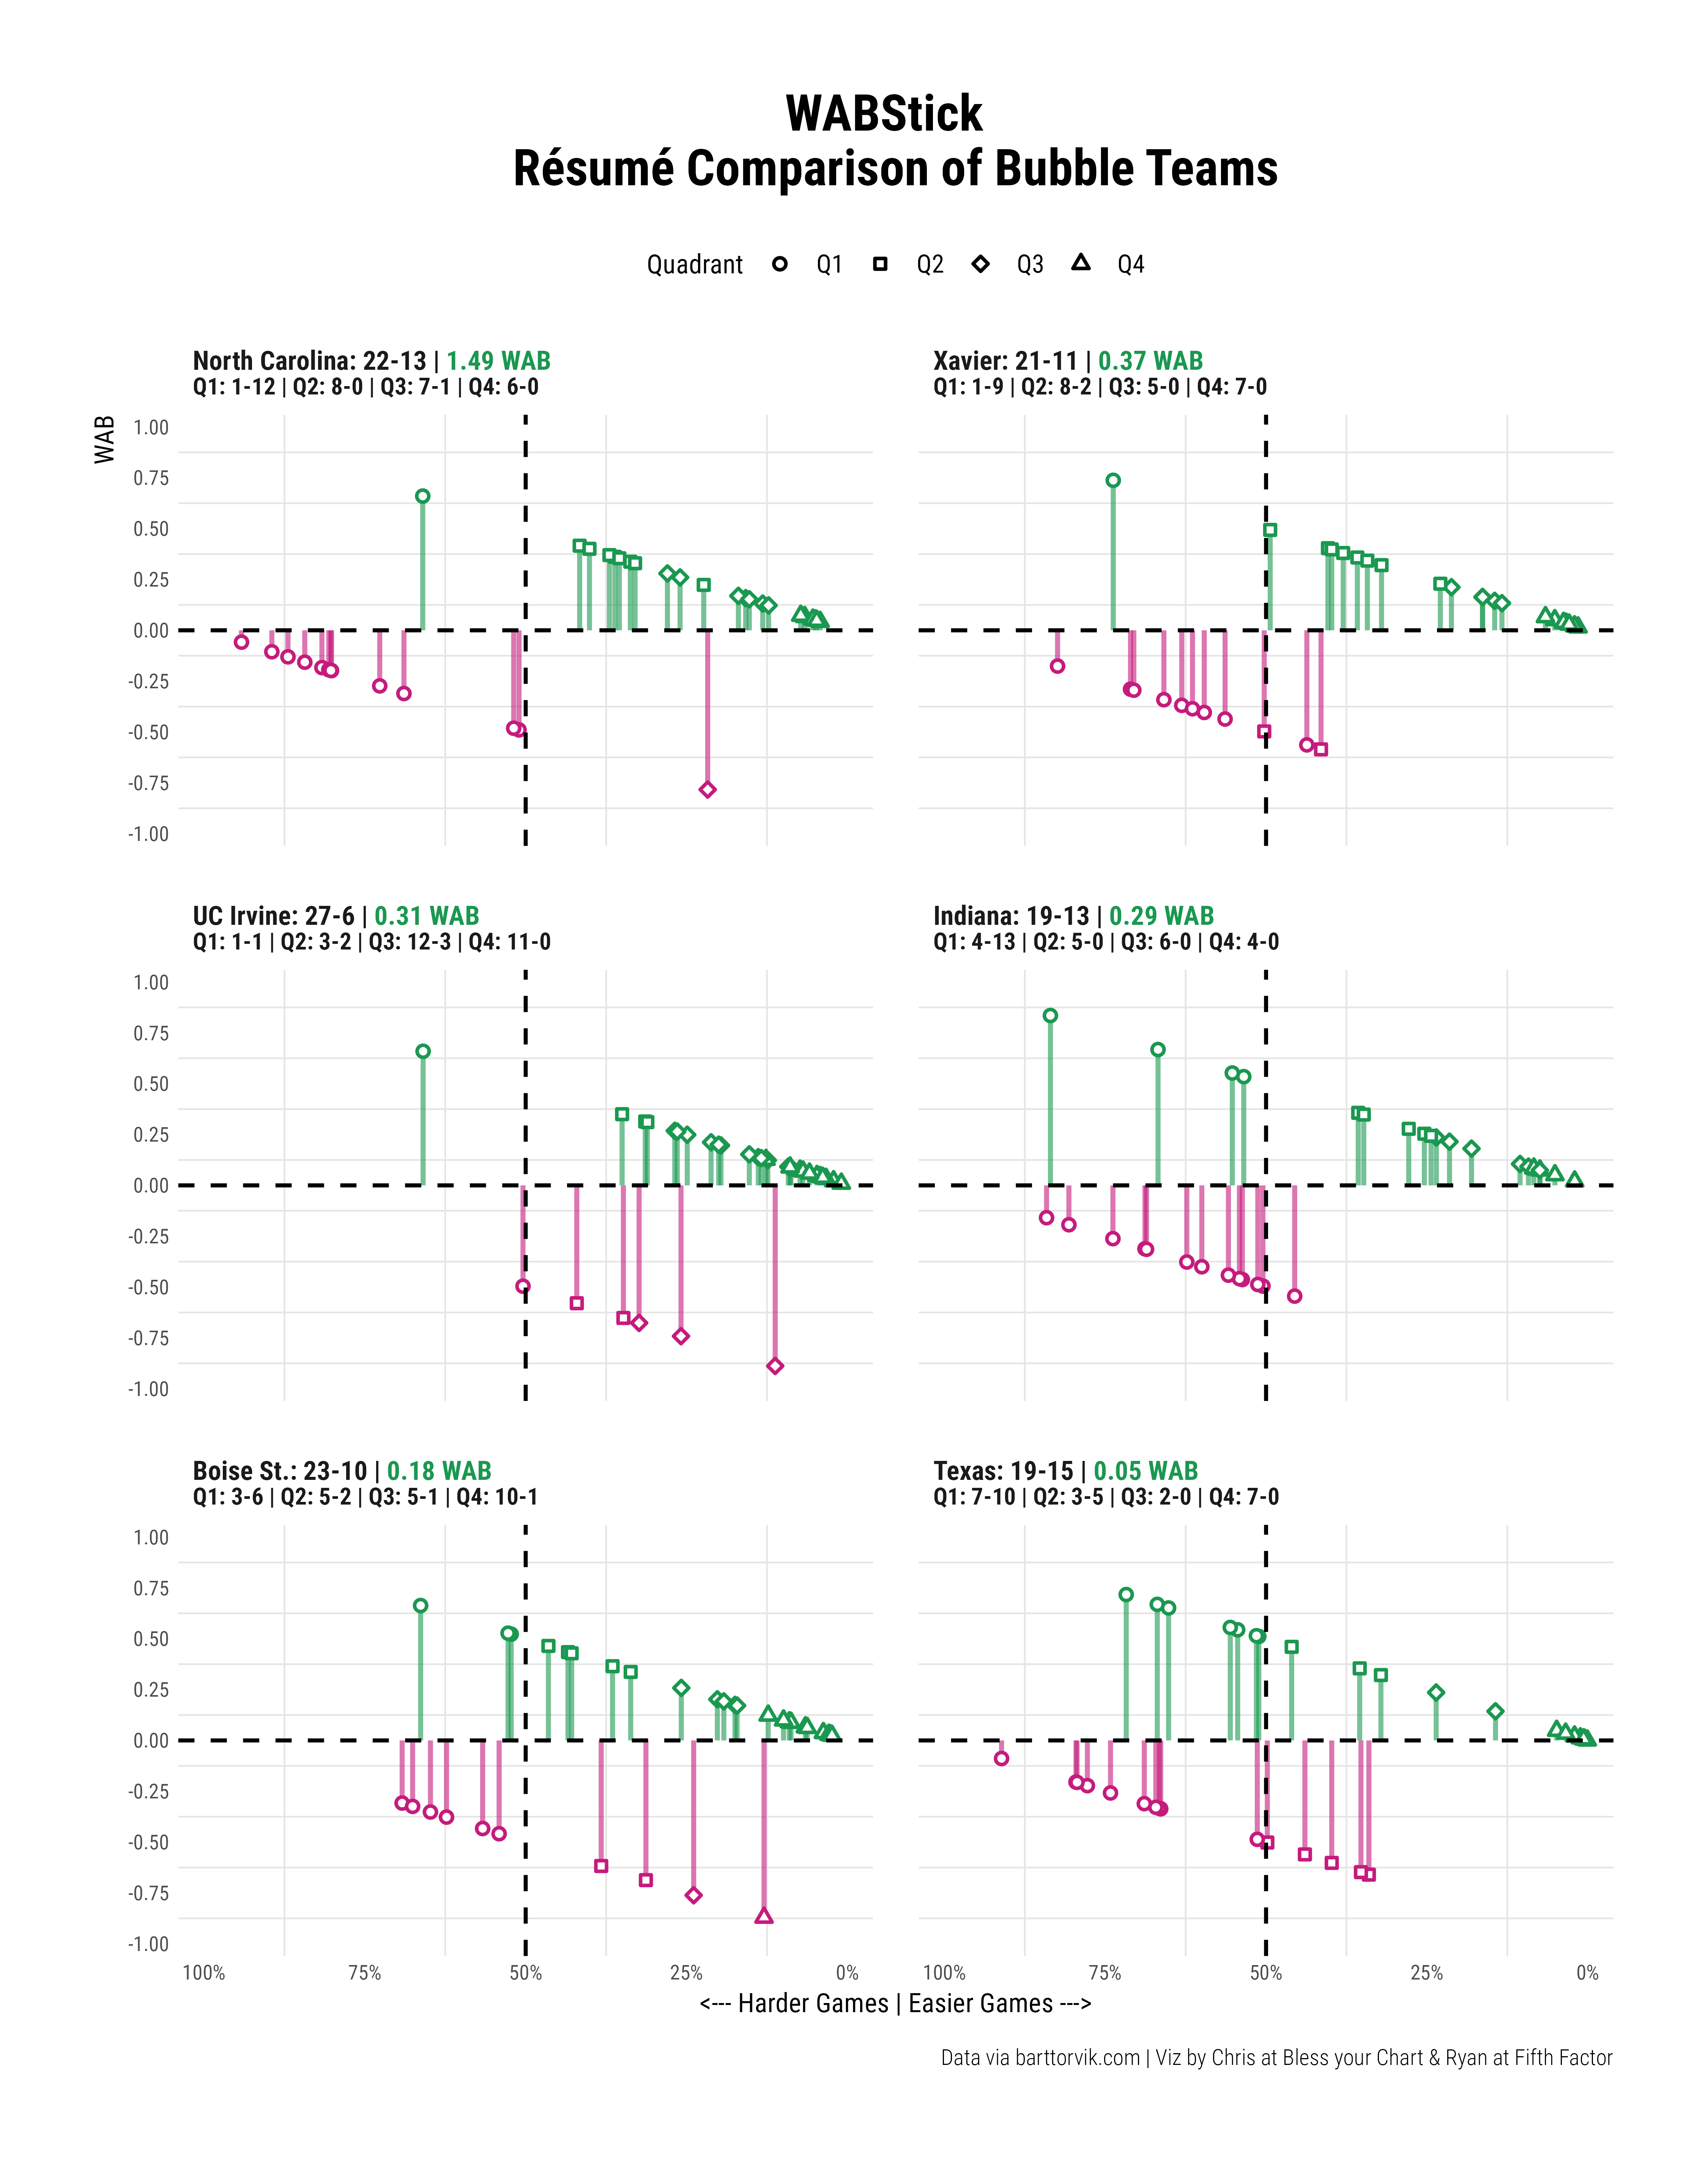
364 teams and a 30+ game regular season schedule means there is never going to be perfect balance5. This is all the more reason why determining credit for a team's wins and losses is important.
When we take out our WABStick, we can see each team's results plotted with difficult games to the far left and easier games to the right. All games are not created equal in any quadrant.
So what will the committee do?
If I've learned anything in life, it's to avoid leaving decisions to committees whenever possible. The committee can and will do whatever it wants, and there are more than enough numbers available to retroactively justify almost any decision.
But we'll know if they truly use the résumé metric or not based on their selections for perhaps the first time ever because WAB is on the team sheets.
Anywho, for many bubble teams, it’s feeling a half past dead.
Thanks for reading this far, and following along up to Selection Sunday. I’ve been tracking WAB data all season in this tiny web app: byc.evidence.app
As for a recommendation this week, this USA Today article by Mark Giannotto does a great job of laying out metrics and makes a compelling case of WAB.
🤟 Enjoy your Sunday 🤟
Sort of makes sense why NCAA doesn’t publish the raw rating. No priors, a committee of 12 people, you want to retroactively validate any decisions without too much scrutiny.
Pun intended.
Teams on the bubble include North Carolina (22-13, Torvik WAB Rank: 42, NET WAB Rank: 43), Texas (19-15, 54/46), Indiana (19-13, 50/48), Xavier (21-11, 49/49), Boise State (23-9, 52/53), and UC Irvine (27-5, 51/54).
It’s not surprising the teams in the other power conferences (SEC and Big Ten) show a better NET WAB rankings than Torvik because the NET doesn’t have any preseason ratings baked in.
North Carolina played a ton of games of consequence and didn’t earn a positive result in many games of consequence. Ultimately, this is why I don’t expect UNC to receive an at-large bid. There is a case to be made with résumé metrics though.
I think we’ve lost the plot if we’re now recommending teams play softer schedules. In this era of college basketball, a softer schedule is an illusion. There is a good amount of chance to a team's schedule. Rather than schedule softer, teams should try to win more.