129: Faces of college basketball
Four factors of college hoops teams using Chernoff faces, plus a possession plot after the Duke/UNC game.
How can we compare college basketball teams without staring at numbers?
Ryan Campbell,
, had an idea that he shared with me1. In reality, it was a plot using a bunch of different faces.Chernoff faces are a concept that takes statistical values for a series (such as cities, states, or in this case, college basketball teams) and displays them as facial characteristics. The idea being that we are good at quickly comparing and noticing facial features.
This is a fun way to compare teams using their Four Factors (eFG%, Rebounding, Free Throw Rate, Turnovers). Each face has features that reflect the team's statistics.
Offense is shown as height (taller = better) and defense is shown as width (skinnier = better). So, taller and narrower features indicate a better team.
Here are the Chernoff faces of the ACC teams through February 1 games:
You can scan the faces two ways, either glance around for similar faces to see teams with similar profiles, for example, Syracuse and Georgia Tech look pretty close.
Or you can choose a single feature, like noses, to learn about which teams rebound at the same rate - Cal and SMU have the same nose, so they probably rebound the ball the same. Also, Virginia's nose is incredibly short, and yes, the Wahoos are 347th in the country in offensive rebounding rate.
Given Duke looks like an alien compared to the other ACC teams2, how does Duke's face compare to other top teams in the country?
Here is a look at the faces of the top 16 teams in Bart Torkvik’s ratings as of today:
Notice how Houston and Duke have skinner mouths, indicating the stout defenses of both squads compared to the wide mouths of Texas Tech and Alabama, two teams with defenses outside the top 30.
The height of Auburn’s hair shows the Tigers do a sound job of avoiding turnovers, ninth in the country as of today, but they’re also average in turning over opponents (177th in defensive turnover rate).
The opposite is true for Tennessee as the Volunteers rank first in the country in defensive turnover rate (notice the width of the hair), but 136th in offensive turnover rate.
The big eyes on Purdue and Missouri reveal that shooting performances of both teams is extremely effective. The Tigers rank 14th and the Boilermakers rank 16th in offensive eFG%. The same eyes show these two teams don’t defend all that well, compare them to the “pinhole” eyes of Houston.
I’m not sure what face I was making while watching Duke decimate North Carolina Saturday, but my goodness what a beatdown.
Duke-UNC possession plot
Duke scored 1.34 points per possession, good for the fifth highest by a North Carolina opponent in the kenpom.com era or since the 1997 season.
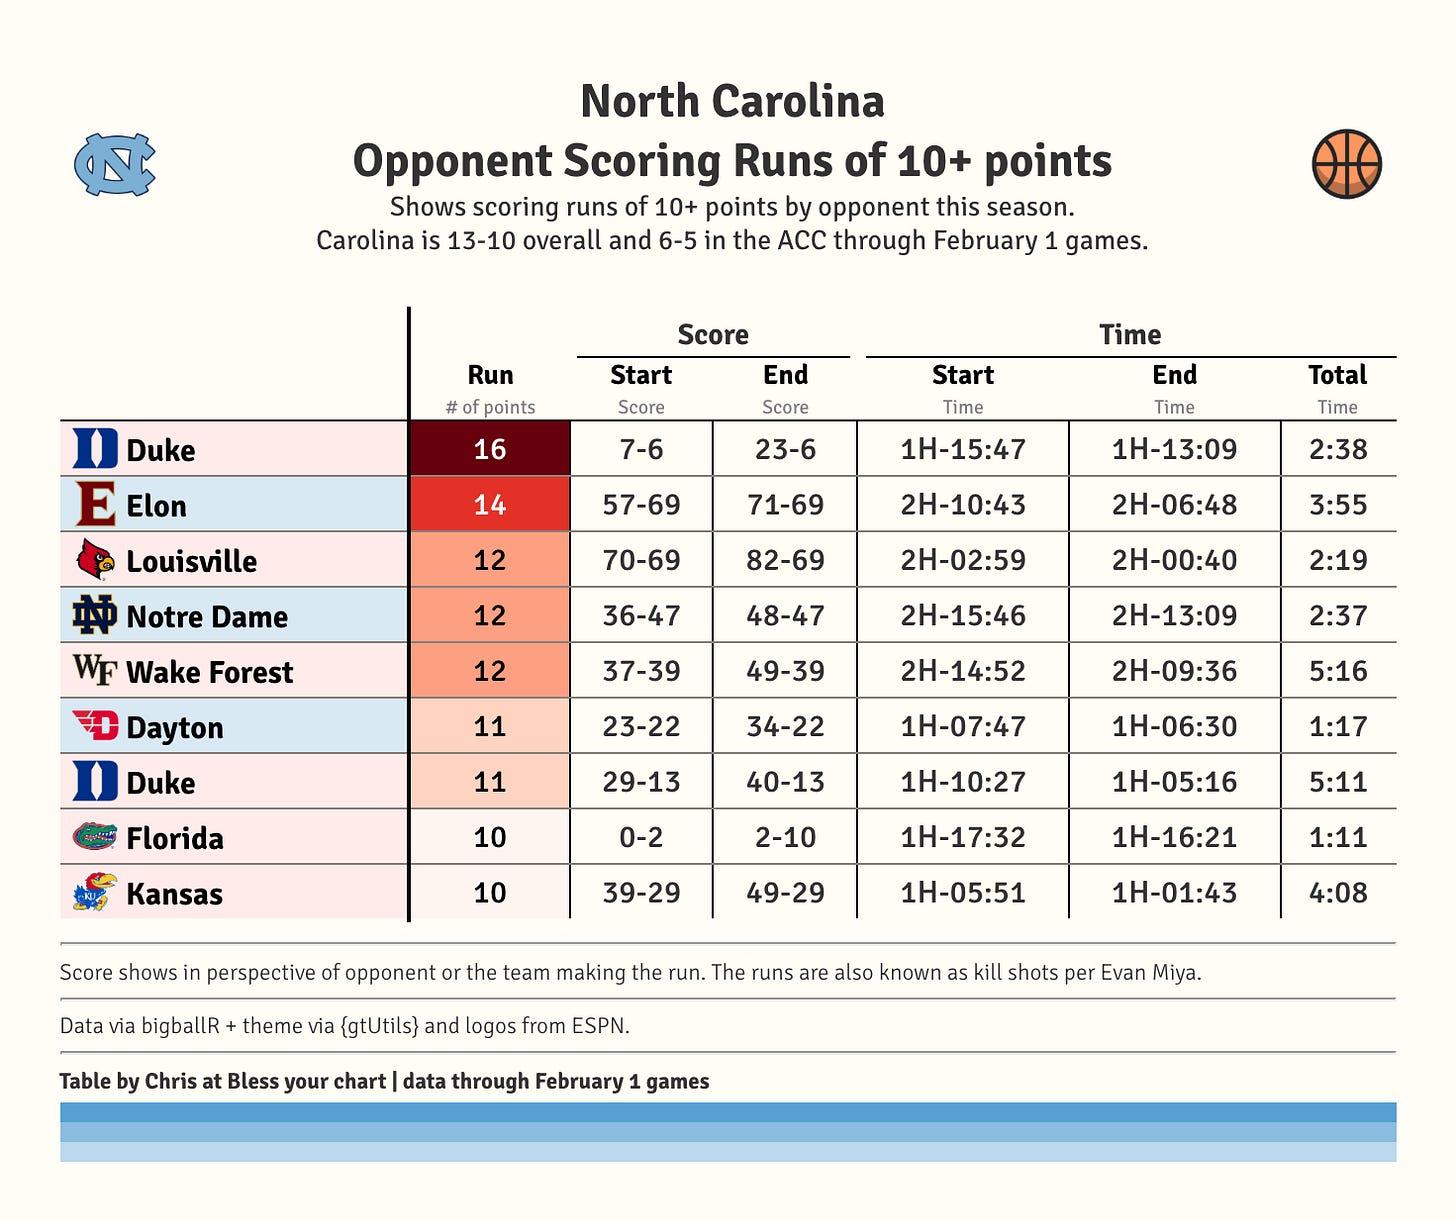
The Blue Devils used a 16-0 run that spanned two minutes and 38 seconds to open a 17-point lead over Carolina only seven minutes into the game Saturday.
After Carolina broke its scoring drought, Duke then delivered a methodical 11-0 run over the span of five minutes and 16 seconds. Duke led 40-13 with about five minutes left in the first half.
The plot below shows the different possession over the game. Each possession has a result indicated in red (missed shots, turnovers) or a shade of green (free throw trips3, two-pointers, and three-pointers).
The average in-game score differential was 18.9 points. The game was not competitive and you almost got the impression Duke could pick the final score margin if it wanted to do so.
Carolina has now allowed nine scoring runs of 10+ points by opponents this season. Duke is the first UNC opponent to do it twice in one game, let alone twice in the same half.
Here is a table showing those nine runs of 10+ opponents. Carolina is 3-5 in these eight games:
🤟 Happy Monday, and thanks for reading this far. Please consider subscribing and/or sharing this post. 🤟
Ryan helped me a ton with WABStick last season, it was his idea, and I’ve repurposed a ton of his other ideas and code around WAB this season in this tiny app: byc.evidence.app - almost every time I ask Ryan about an idea for a plot, he gives me a way to make it better.
Look at Florida State’s ears! The Seminoles are 33rd in the country in free throw rate.
There are so many permutations of free throw trips that it makes it hard to surface on the plot. If you see a 1 followed by a 2, that usually indicates two free throws, but it can also indicate a three-point play (and-one, plus one free throw). I'm open to ideas to make this better, so please let me know.


