


075: Introducing WABStick™
A tool to compare college basketball teams ahead of the 2024 NCAA Tournament.

WABStick™ is a tool to compare two teams competing in the 2023-24 men’s college basketball season.

WAB stands for wins-above-bubble or wins-above-baseline1. WAB is a résumé metric that reflects how many more (or fewer) games a team has won against its schedule than a bubble-quality team would be expected to win against that same schedule.
For example, if a bubble team would be expected to go 10-10 against a team’s schedule, but the team is actually 15-5, the team’s WAB is +5.0. If the team were 5-15, the team’s WAB would be -5.0. If the team is 10-10, the WAB is even or 0 WAB.
WAB doesn’t reward teams for “good” losses or punish teams for “easy” wins. WAB avoids binning games into quadrants that are of different difficulties2. It puts an emphasis on wins and not scoring margin.
This dashboard is built in partnership with Ryan Campbell (Fifth Factor)3. You may know Ryan from his past plots or infographics explaining WAB. Stay tuned for more polished versions of a similar plot too.
All code written in R and built with Quarto Dashboards. The data source is cbbdata, a R package built by Andrew Weatherman that makes data from sources like barttorvik.com more accessible.
How does the plot work?
You can select two different teams to compare resumes based on their current record or scheduled games. The height of the bar represents the chance a bubble team would have to win or lose the game. Hover over the lines to see the result of the games or the potential WAB of future games.
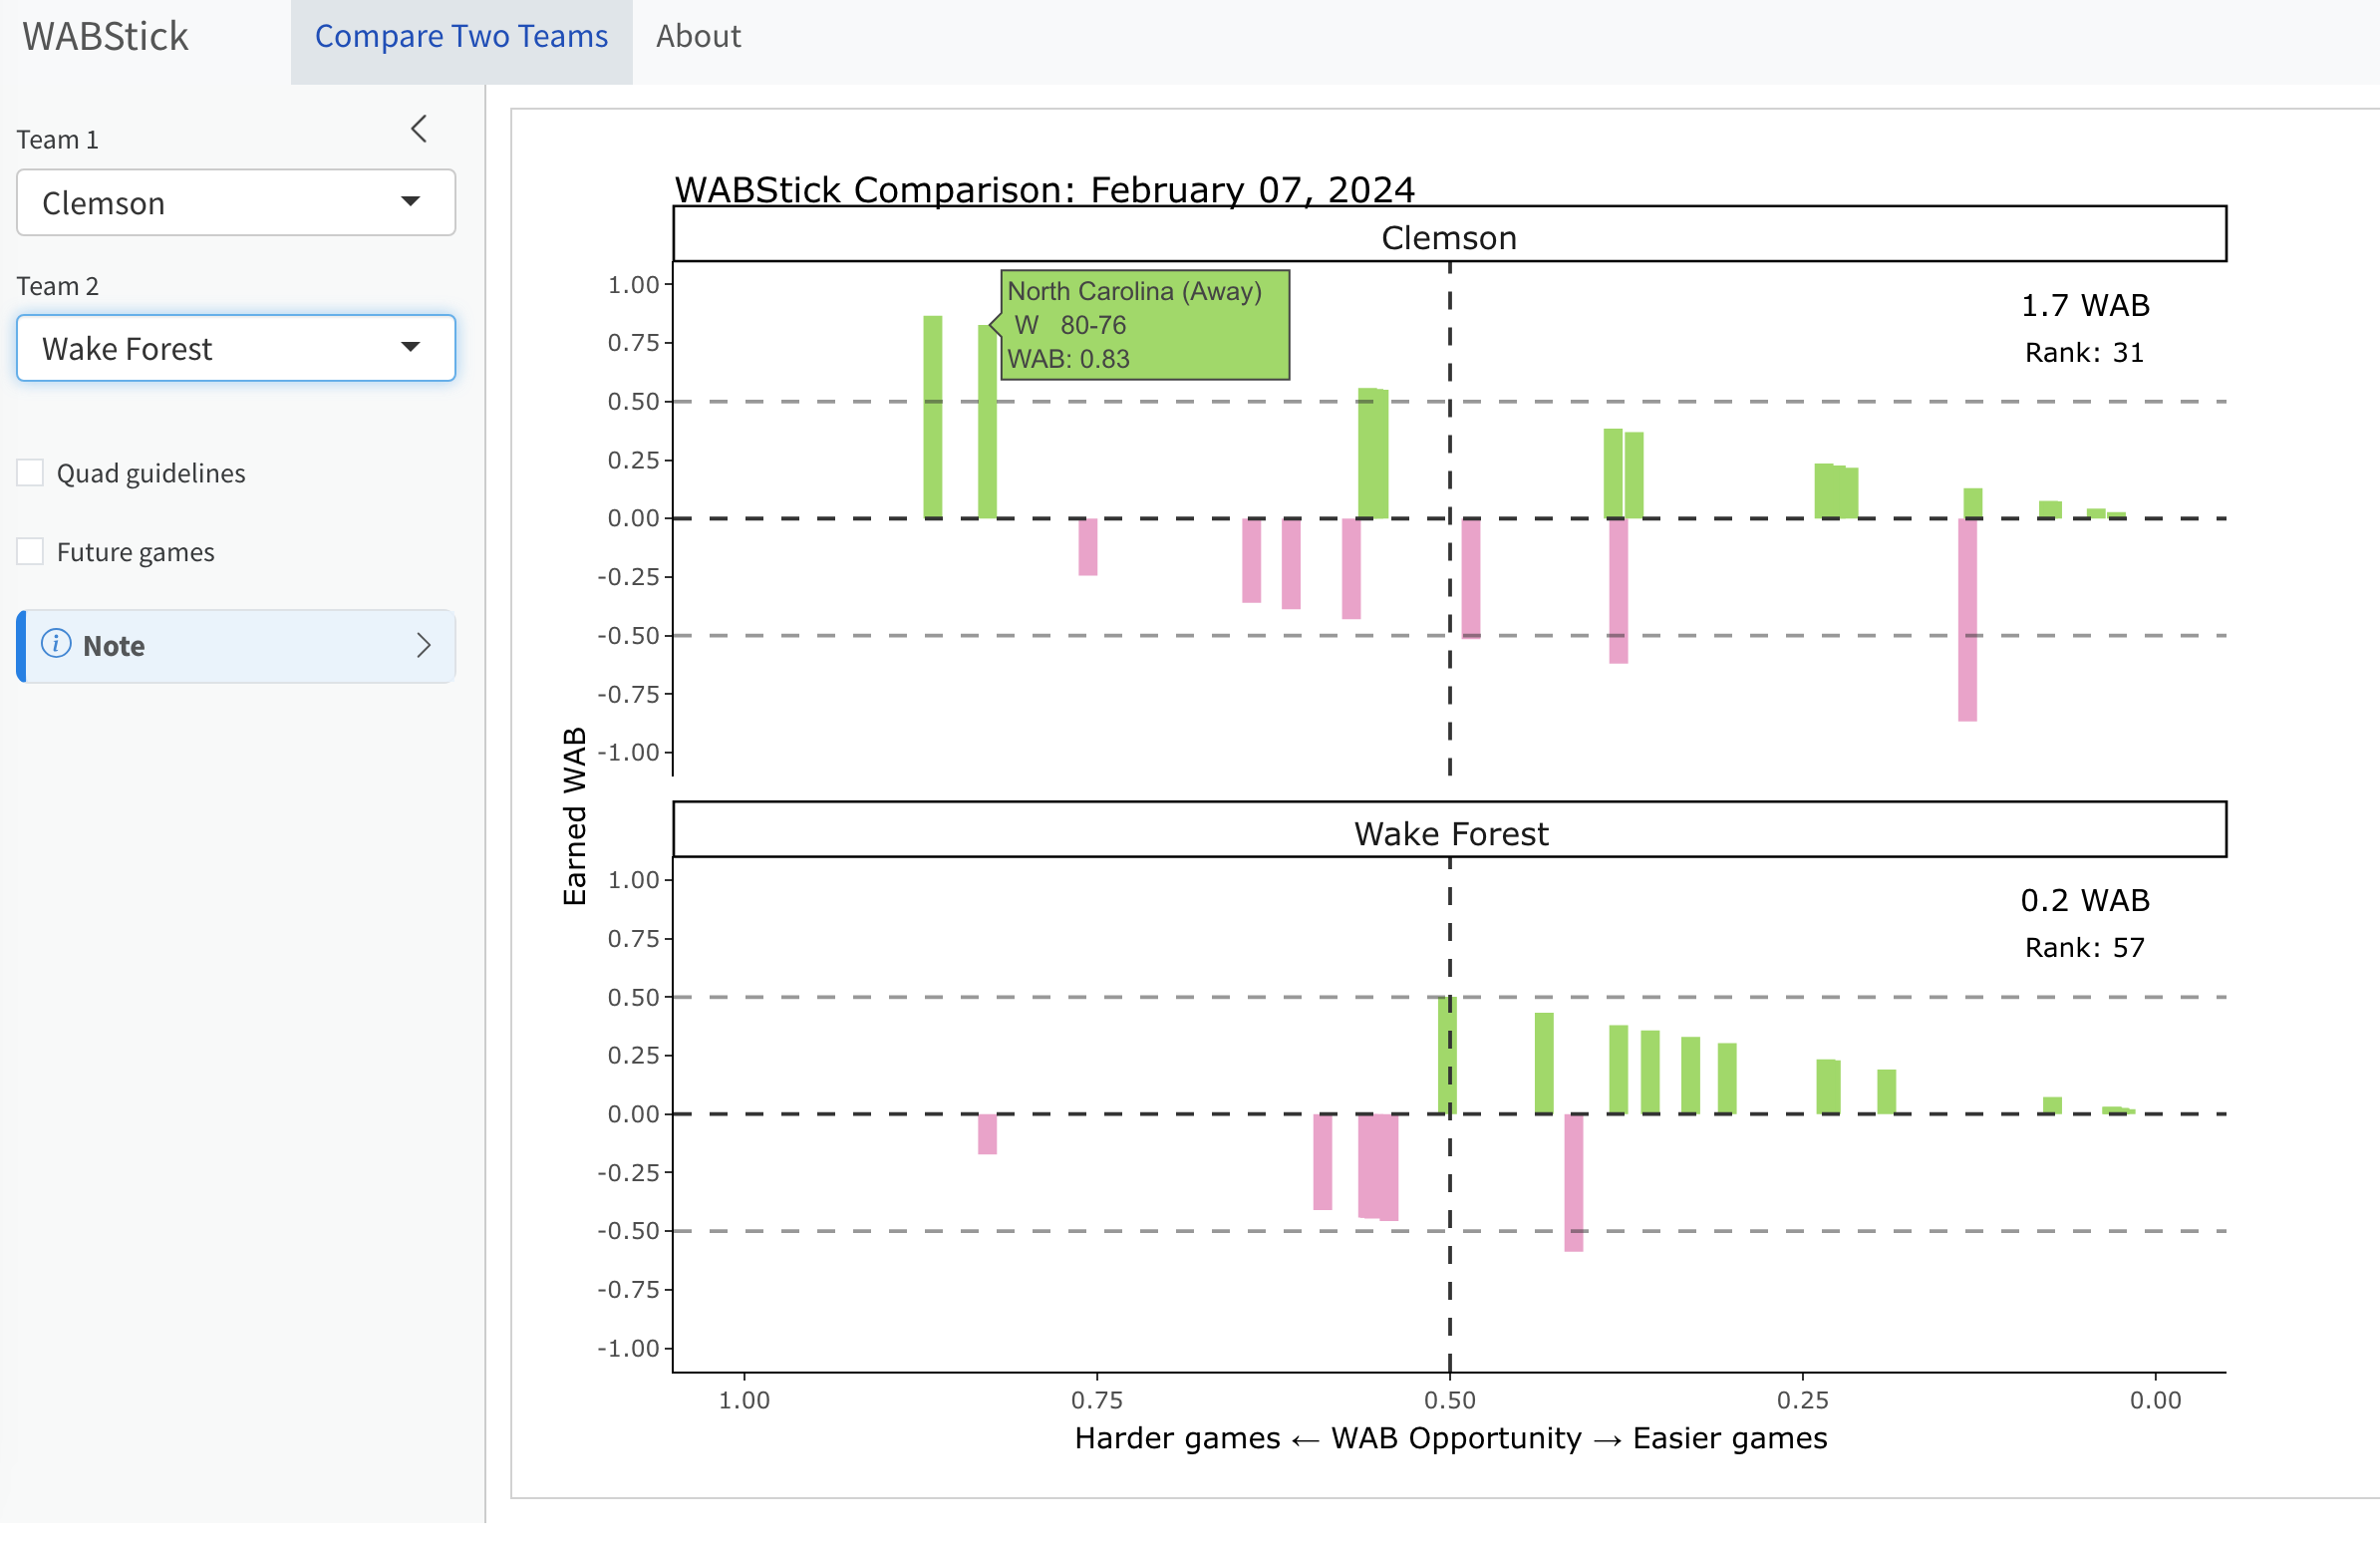
Green lines are wins, representing gains in WAB (above the x-axis), red lines are losses which result in negative WAB (below the x-axis). Future games are gray and appear on both sides of the x-axis - illustrating both the possible gain and loss, to-be-determined until the game is played.
Position along the x-axis indicates the difficulty of the game. For example, games on the left are generally harder, which means there is a bigger reward for winning the game and a smaller risk to losing the game.
The opposite is true towards the right end of the x-axis. These games are often easier, so a loss is risky or damaging to a team’s résumé, while the reward is minimal.
Quad guidelines and future games
The quad guidelines are derived from the WAB of a game and the current NET ratings. These lines are drawn to show roughly where the games fall within a specific quadrant. For example, the first line is drawn between the “easiest” Quad 1 game and “hardest” Quad 2 game - where difficulty of the game is based on WAB.

While WAB calculates the precise difficulty of each game, quadrants are more arbitrary groupings, so it is possible that a Quad 2 game will be worth more WAB than a Quad 1 game. This might mean a game is listed under Quad 2 on the chart, but it’s a Quad 1 game based on the actual Team Sheets4.
Future games can also be blended into the chart, so you can visualize future WAB opportunities for the remainder of the season.
The app is best viewed on a desktop device. And if you have any feedback, please let us know on Twitter - @dadgumboxscores and @5th_factor.
Remember, the map is not the territory
College basketball is a fascinating social experiment. There is treasure troves of data available. Advanced metrics, predictions, betting markets, and lots of smart fans.
We have media personalities celebrated for being “Bracketologists” that stay in a bunker5. It turns out the general public is actually a much better judge of which teams have a chance to make the tournament.
The tournament itself makes billions of dollars. People gamble on it, and they can do so legally now. The beauty in the tournament itself is its randomness. Cinderella stories. Upsets.
We all want to be right. And today if you believe something, it doesn’t take a ton of effort to find information that supports that belief.
Remember, that the map is not the territory.
NET. WAB. Torvik. Kenpom. EvanMiya. These are models or maps. Think of them as representations of college basketball.
These maps are useful. But they’re not a perfect depiction of the territory or reality. That’s impossible. The real world is messy.
For example, kenpom6 is often cited by media and fans for its conference ratings. The ACC is fifth across all 30+ conferences.
Do you know how those rankings are derived?
Pomeroy explains that the ranking of conferences is by adjusted efficiency margin of a team that's expected to go .500 in conference play. The fine print of the methodology explains further:
The same method is also used to rate conferences. A conference’s rating is the strength of team that would be expected to go .500 against a round robin schedule.
These rankings are sound. It’s a great map. The ACC is not the best conference. But the ratings itself are also not the territory.
Conferences are so big today that few of them actually play a round robin schedule.
Consider NCAA Tournament hopeful NC State. The Wolfpack play Duke once this season7, and it’s at home. Other bubble teams like Florida State and Clemson only get to play the Blue Devils once too.
Pomeroy also has ref ratings available on his site. Those “ratings” only credit the officials assigned to the most competitive games based on Pomeroy’s Thrill Score.
It’s a map and a damn good one. There is legitimately no other ref ratings that I’m aware of today. You may also want to consider what other information might be missing from that methodology. Do the best refs really get the best games?
This is why I find WAB to be a better metric for assessing the résumé of two teams. It’s a closer representation of the territory or reality. It’s far from perfect, but it reminds you that the games actually do matter.
🤟Thanks for reading this far, and please check out WABStick. If you find it useful, please consider sharing it with others and helping us improve it. 🤟
WAB was made popular by Seth Burn and it can be found on helpful advanced metric sites like barttorvik.com.
Did you know that ~16% of games with a WAB worth 0.4 are Quad 3 games, 76% of those games are Quad 2, and ~9% are Quad 1. The exact same WAB split across three of the four quadrants.
Ryan sent me this idea as a hand-drawn sketch. He is wicked smart, and he is behind the math to compute a lot of WAB data.
If you’re looking for quadrant breakdowns by conference, check out the other tiny app I wrote too: CBB Conf Index
Lunardi’s red highlight text on black font is objectively terrible.
I once read that Pomeroy prefers that kenpom is all lowercase and not camelcase, so I always type it out as that, and every time think I’m wrong.
ACC has borked a lot of things over the years, but the league scheduling is amongst is most unimaginative things out there in my opinion. Where is the Fishbait Solutions creativity?