073: Head-to-head conference records
Adding head-to-head conference records and a disclaimer.
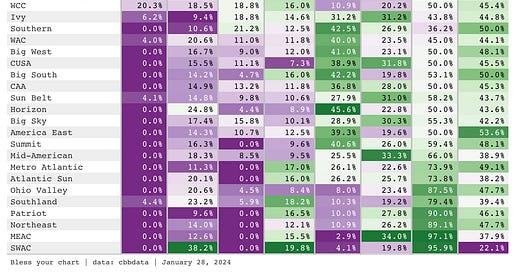
You can now find head-to-head conference records using this tiny app:
Go to the Head-to-Head tab to filter by a conference to see how teams from that conference performed against other conferences.
The table surfaces the total number of games, the overall win/loss record, and the win/loss record by quadrant. You can corroborate the overall non-conference records using WarrenNolan.com data.
For example, you can see the Big 12 has won ~80 percent of its non-conference games at WarrenNolan.com, but against which conferences?
The table is built to answer that question.
Here is a quick video example of how to use the filters:
Please keep in mind as the NET numbers change, so will the quadrants, so those records can fluctuate throughout the rest of the season despite the lack of non-conference games over the next several weeks.
The goal of the project remains to surface conference data and share it with others. The next frontier is to filter by games against each conference to provide more detail.
I might be workshopping a conference “team sheet” in the future too, so stay tuned for more updates.
And now a disclaimer
When a measure becomes a target, it ceases to be a good measure.
Goodhart’s Law sums up where we are right now with the discourse around the NET. Jon Rothstein doesn’t want to inform you. He wants to entertain you, and he might be bad at doing that most of the time.
I would caution you not to use the head-to-head conference data as gospel. If your immediate take away is that the Big 12 is a fraud conference, I’m not sure you’re thinking critically enough.
If you think the ACC should be a two-bid league based on the head-to-head data, you’re also not being serious in your thinking either.
I think the NET makes people angry because we have a tough time understanding it. That’s an indictment on the NCAA and how it’s presented.
A few assumptions because I’m not even sure I understand it:
NET is trying to be a one-size-fits all metric. It has data that attempts to be predictive because efficiency matters, but it also presents data that is descriptive (TVI or team-value-index).
If it’s purely predictive, not having an actual power rating is confusing at best and dishonest at worst. For example, do we know the difference between the TVI between the 10th ranked team in the NET and the 76th ranked team?
Quadrants are arbitrary, and often presented with a lot of emphasis. For example, Q2 games can be harder than Q1 games.
All this to say, it’s hard to discern if the NET is a power rating or a résumé rating. And I suspect that is the reason for the angst.
Because Power Ratings ≠ Résumé Ratings
Power ratings are predictive. This means a team can receive a jolt in its rating by how it performed even in a losing result. Point differential is important. Efficiency matters, and the result is not paramount.
Résumé ratings are descriptive. A team should not be punished for a win or rewarded for a loss on its résumé rating. This is the gist of why the RPI became a problematic metric.
Strength of schedule is important. Yes, teams from the Big 12 played a ton of Quadrant 4 games in the non-conference, a 100 games to be exact or ~56 percent of its non-conference games. And ~67 percent of Big 12 league games are in the first quadrant too.
I think this issue is we suspect that the NET is rewarding Big 12 teams for playing a softer non-conference slate and a tougher conference schedule.
But it’s also important how Big 12 teams perform against those schedules too. This is why résumé ratings like WAB (wins-above-bubble) or Parcells are important. It’s also why Ken Pomeroy himself stated his own ratings are not designed to pick teams for the tournament.
Strength of record is key.
Anyhow, thanks for reading this far and please subscribe below if you want to read future posts.


