
185: ACC baseball standings, run differentials, and RPI bingo

The first week of May is as good a time as ever to check in with college baseball. Believe it or not, about 85 percent of the regular season is already complete.
In the past this newsletter has explored the consequences of bloated conferences in football and men’s basketball, but how does this show up in baseball?
There are 16 teams that play baseball in the ACC and each team is scheduled to play five three-game series home and away. There are two weekends left in the regular season, and here are the updated standings with run differentials.
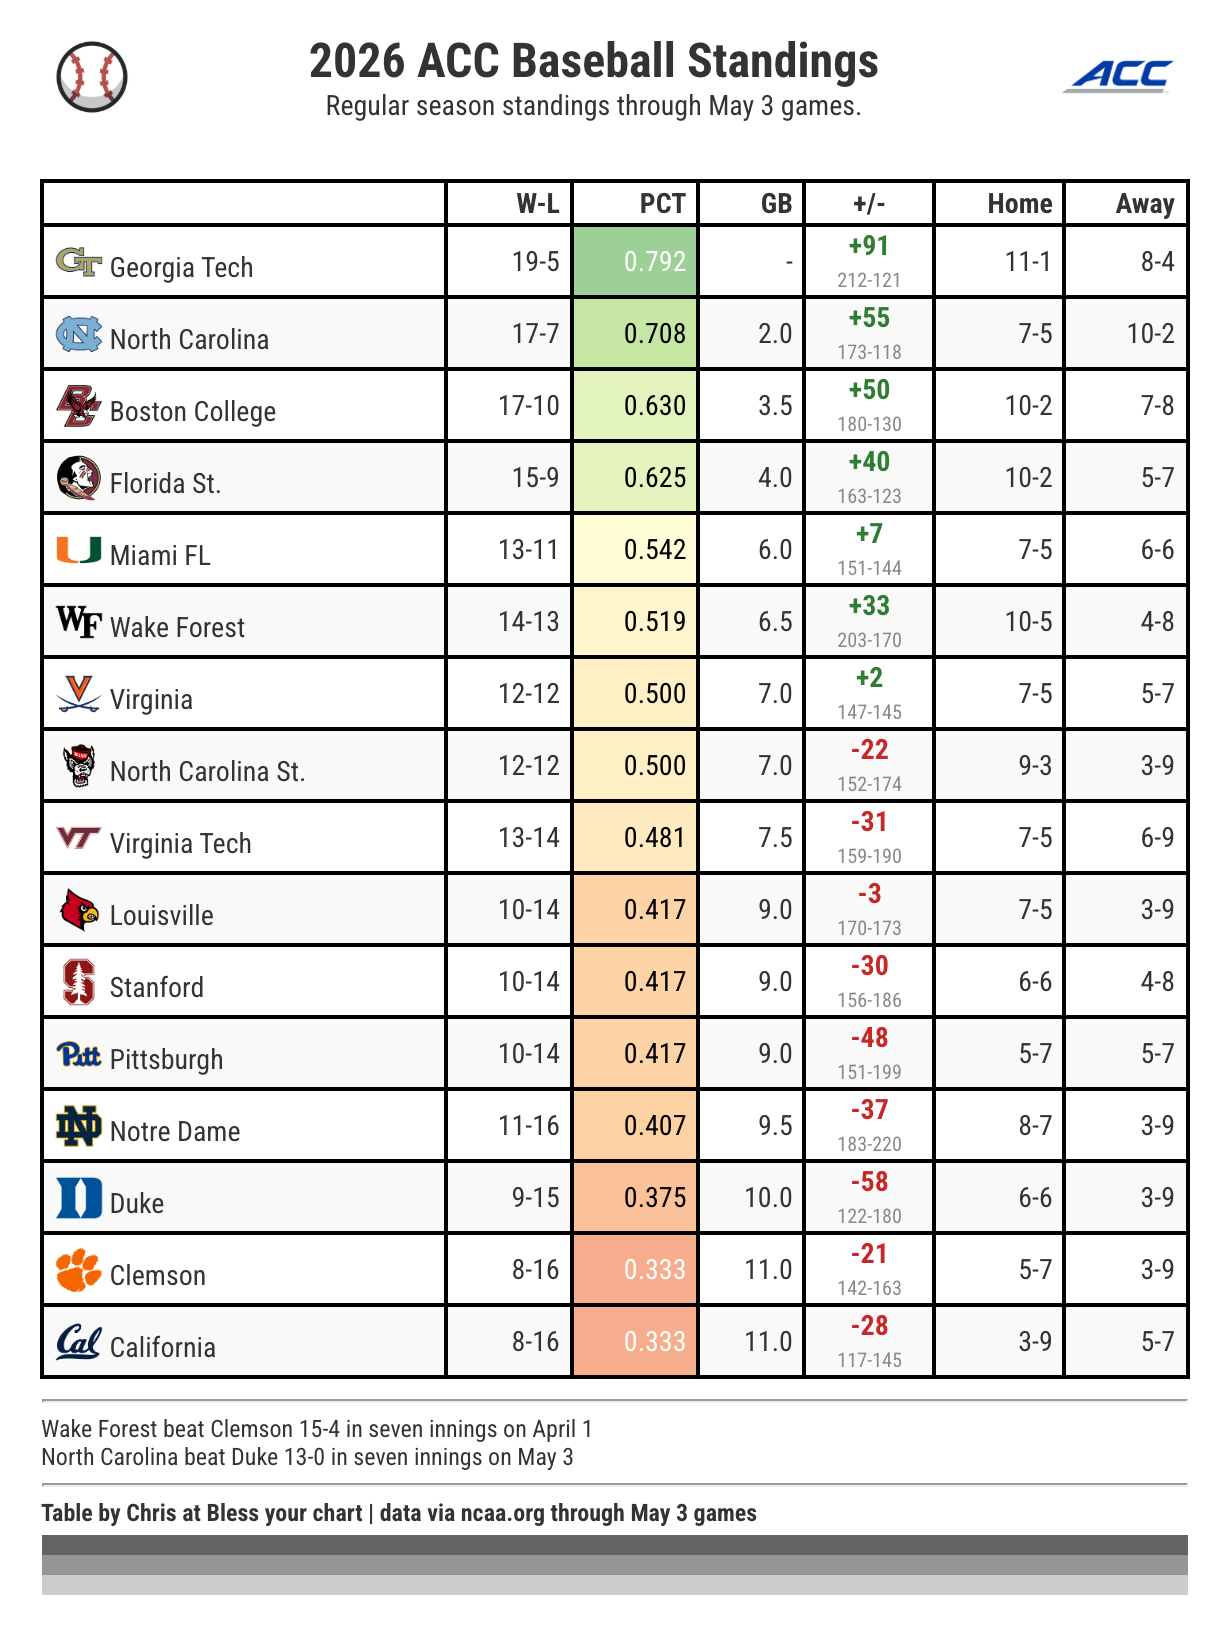
The 2026 ACC baseball tournament starts May 19 in Charlotte, North Carolina. It marks the second straight season that all 16 teams earn a spot in the tournament.
The top four seeds receive a double-bye and seeds 5 through 8 receive a single-game bye. The number of tiebreakers are plentiful. The tiebreakers include head-to-head results, winning percentage against common opponents, run differentials, and even a coin flip.
Given each team misses five opponents in its own league, the tiebreakers are likely going to be used. Unbalanced schedules are more of a feature than a bug in major conferences.
Last week, North Carolina was scheduled to play three games during its exam period. The first was a 12-2 home loss to Coastal Carolina on Tuesday. The next day Carolina canceled its home game against Queens due to impending weather, despite it not raining until about 10 pm that night when the game was scheduled at 6 pm.
Now why would Carolina cancel that game?
Of course, weather was the provided reason, but it doesn’t take much to convince people that the game was canceled to protect the team’s RPI.
This is an all too frequent occurrence across college baseball over the past few seasons. 11point7.com even created an RPI Bingo card for any midweek cancellations.
NC State cancelled today’s game against North Carolina A&T. The two schools did not use weather as the excuse. Instead both programs mutually agreed to cancel the game.
What’s the deal with the RPI again?
The Ratings Percentage Index or RPI is one of the primary tools the NCAA selection committee uses to evaluate teams for the postseason. It’s featured prominently on all the nitty gritty reports provided by the NCAA.
RPI = (WP × 0.25) + (OWP × 0.50) + (OOWP × 0.25)
The three components:
team winning percentage (25%)
the opponent winning percentage (50%)
opponents’ opponents’ winning percentage (25%)
The gist is who you play matters as much as whether you win.
A fun feature on warrennolan.com is impact games to show what a team might gain or lose in RPI points based on the result. Here is an example today using the Miami and Florida International game, and you can see why teams might cancel.
A Miami win delivers -16 RPI points to the Hurricanes.
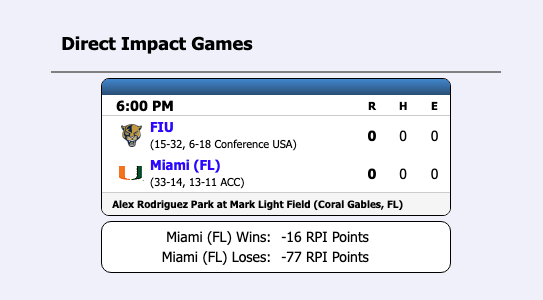
As of now, Miami and FIU are still scheduled to play. In fact, it’s the last Tuesday special at Alex Rodriguez Park at Mark Light Field where you can get $4 beers and $2 hot dogs.
The RPI is a tried-and-true metric that is also outdated and flawed. Other metrics have emerged and there are tons of college baseball data analytic sites today that surface these metrics.
d1baseball.com surfaces DSR (Diamond Sports Ranking) from 643charts.com
PEARatings.com provides a composite NET rating complete with quadrants and tons of information
64analytics.com has a ton of player stats and rankings, mostly behind a paywall
A D-I baseball team plays over 50 games every regular season. Cancellations are going to happen. Sometimes you win, sometimes you lose, and sometimes it rains.
And now sometimes you don’t play because the RPI?
There is a laundry list of items that are more important for the NCAA to reconcile than sorting out midweek baseball cancellations.
It’s bizarre though in a given week on the calendar that a team like North Carolina can cancel a midweek game because of the RPI and play a conference opponent (Duke) in a non-conference game.
Run differentials
This past football season, we tried to put together line scores for college football and point differentials by 5-minute segments in college basketball.
Baseball is a sport where almost everything is counted. The inning-by-inning run differentials can reveal a lot about teams.
Here is a look at Carolina’s run differential by inning against Top 100 RPI opponents. The NCAA surfaces a team’s record against Top 100 on the Team Sheets and Carolina is 21-8-1 against Top 100 opponents.
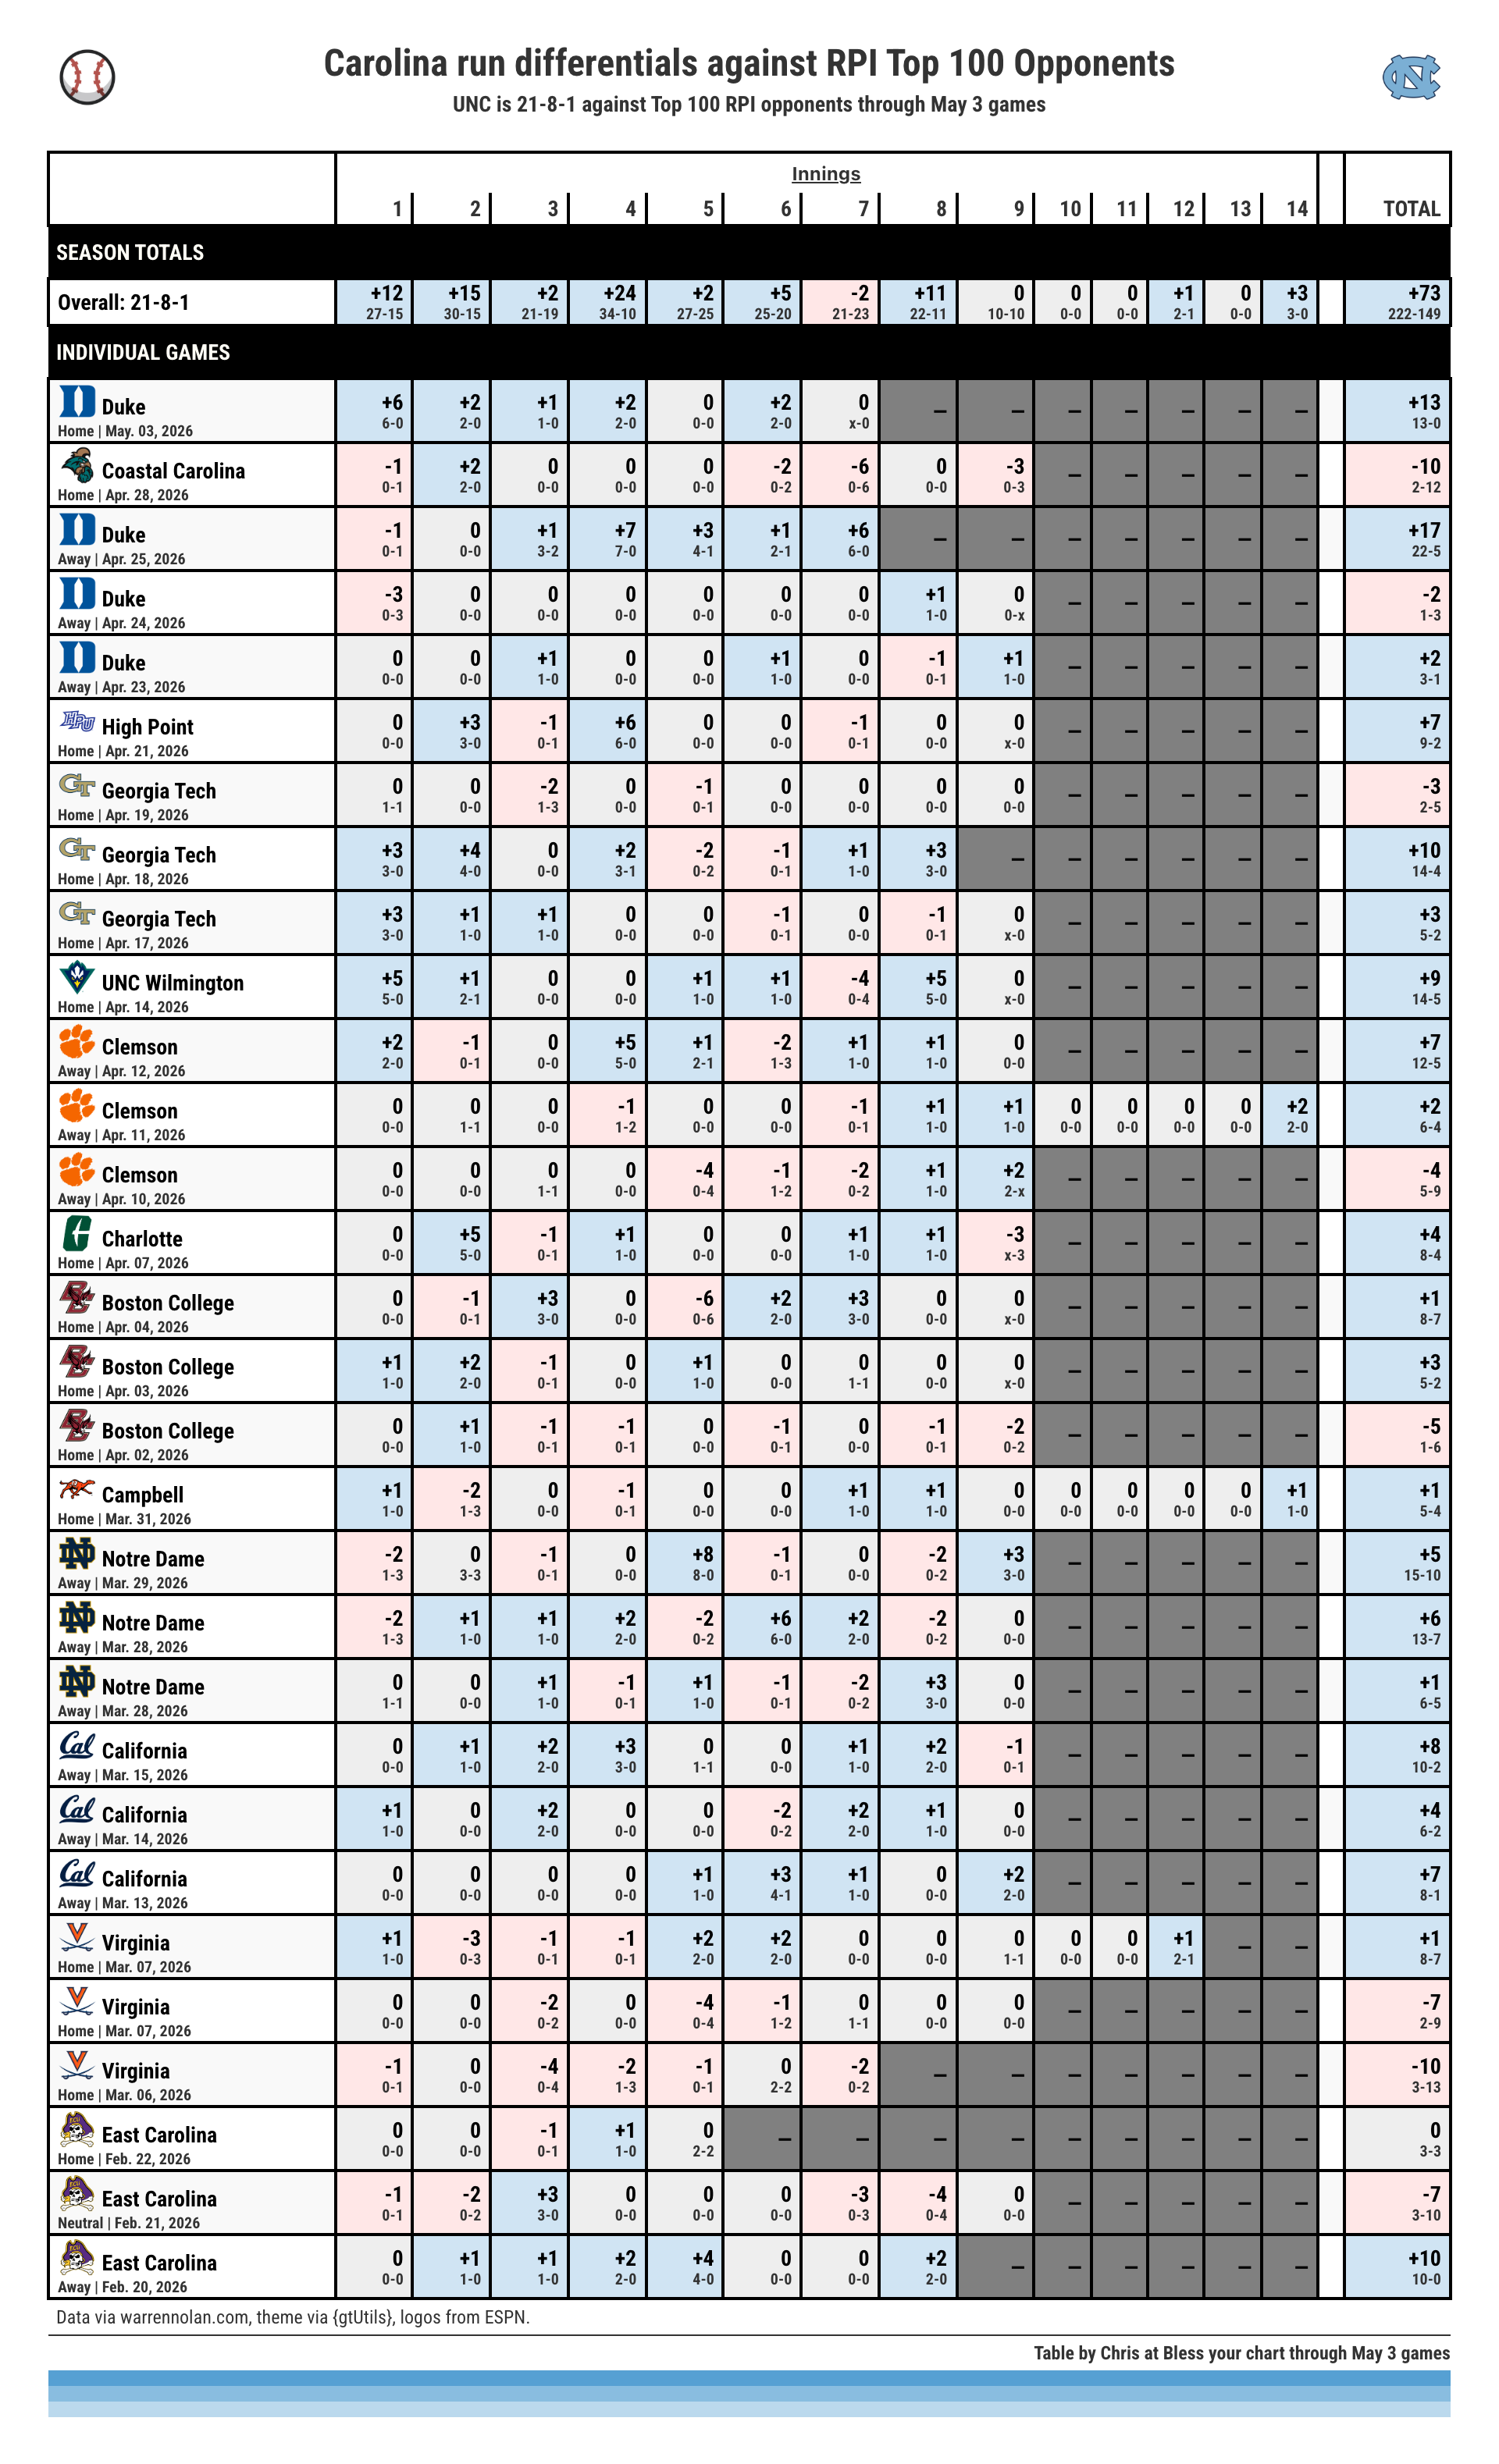
An early lead for Carolina is useful as the Heels are +27 in the first two innings of play against Top 100 opponents, and +73 overall. The only inning that UNC has a negative run differential is the 7th inning (-2 overall).
As we move toward the ACC Tournament in a couple weeks, the next two weekends are about seeding and securing a double-bye. Unbalanced schedules and weather will mean tiebreakers and run differentials will come into play.
That’s it for today, and thanks for reading this far.
A few recommendations this week are a treasure trove of data sites for college baseball: warrennolan.com, PEARatings.com, and d1baseball.com.
🤟 Enjoy the baseball 🤟
that run differentials graphic is beautiful. I'll be staring at it all day, thank you. fun way to see killshots too