


134: The irony of March
Thoughts on the latest college basketball narratives.

College basketball discourse thrives on narratives. This March, two stand out:
The SEC is historically great and the ACC is historically bad
The NCAA Tournament bubble is weak
But do these claims rest on evidence?
Earlier this week, Ken Pomeroy posed an enlightening question around the current discourse in college basketball: Why hasn’t anyone said the SEC is overrated?
It’s a reminder that we often base arguments on limited data points from non-conference play that occurred months ago.
#AccomplishGreatness meets “It just means more”
The SEC's non-conference results are superior to any other league. The 16-team league posted a 185-23 overall record1 in non-conference play, including perfect records against lower-tier leagues like the SWAC (20-0), Southland (14-0), and Sun Belt (8-0).
Even more impressive, the SEC recorded winning records against every power conference: Big Ten (10-9), Big East (5-4), Big 12 (14-2), and most notably, the ACC (30-4). That last record —an 88.2% win percentage against the ACC over 34 games— has shaped much of this season's narrative.
These 34 games represent about 16 percent of the SEC's total non-conference slate. The SEC played 14 more games against the ACC than it played against any other conference.
Meanwhile, the 18-team ACC compiled a mediocre 130-69 mark in non-conference play, with losing records against every power conference: SEC (4-30), Big 12 (3-8), Big East (2-5), and Big Ten (8-9). The 34 games against the SEC constitute about 17 percent of the ACC's non-conference schedule. The ACC played 19 more games against the SEC than it played against any other conference2.
The size of samples
An often overlooked factor in conference strength discussions is when the games are played. All 34 of these SEC-ACC matchups were played over 78 days ago before December 18, 2024.
These games came from three primary sources:
The SEC-ACC Challenge in early December (new ACC members SMU and Stanford were the designated survivors and didn’t participate)
Multi-team eventsEarly season tournaments in November and DecemberTraditional in-state rivalries (Louisville-Kentucky, Georgia-Georgia Tech, Florida-Florida State, Clemson-South Carolina)
This network plot shows which teams from the two conferences faced each other. Some teams had multiple cross-conference matchups.
Tennessee and Florida both went 4-0 against ACC teams, while Louisville went 0-4 against SEC opponents. Others played only one game—Arkansas defeated Miami, while Cal lost to Missouri.

This 34-game sample from the season's first half has created an oversized narrative that the SEC is the greatest conference ever, while the ACC is the worst power conference ever.
Post January Evolution
As Pomeroy points out, do we really know if either conference got better or worse after these 34 games?
We really have no idea if conferences as a whole are improving or not after about January 1, when non-conference play ends. And the talent difference among power conferences probably isn’t as great as the difference in performance in non-conference play would indicate. This season, ACC teams have had more room to improve in general, while it’s hard to believe that SEC teams as a whole could actually get better since non-conference play ended. But it’s really difficult to assess that and to my knowledge, nobody actually tries at all.
Let's accept Pomeroy's challenge and attempt to answer this question using Bart Torvik's Game Score metric. Torvik's Game Score rates each team's performance in individual games on a scale from 0 (poor) to 100 (perfect), with 50 being average. While a single Game Score can be noisy due to the randomness in a 40-minute basketball game, analyzing trends in these scores over time provides insight into team and conference performance.
When we group the conferences and assess their average Game Scores across the season, we see interesting patterns.
# Average Game Score by Conference
| Games        | ACC  | SEC  |
|--------------|------|------|
| First 12 Avg | 48.2 | 90.2 |
| Next 12 Avg  | 45.2 | 93.9 |
| Last 6 Avg   | 68.7 | 82.3 |
At first glance, this data suggests the ACC has improved substantially in the season's final stretch, while the SEC has regressed somewhat. But we must be careful not to misinterpret these numbers like Archie Miller or Karl Ravech.
Since January, both conferences have primarily played games against themselves (only Duke has ventured outside the league). The rise in ACC scores and drop in SEC scores could simply reflect the zero-sum nature of in league competition.
It’s more illuminating to examine individual team performance trends. Looking at all 34 teams in these conferences reveals substantial changes in their trajectories.
Here is a list of all 34 teams breaking down performance in the similar buckets: first 12 games, next 12, and last six games along with the season long performance3.
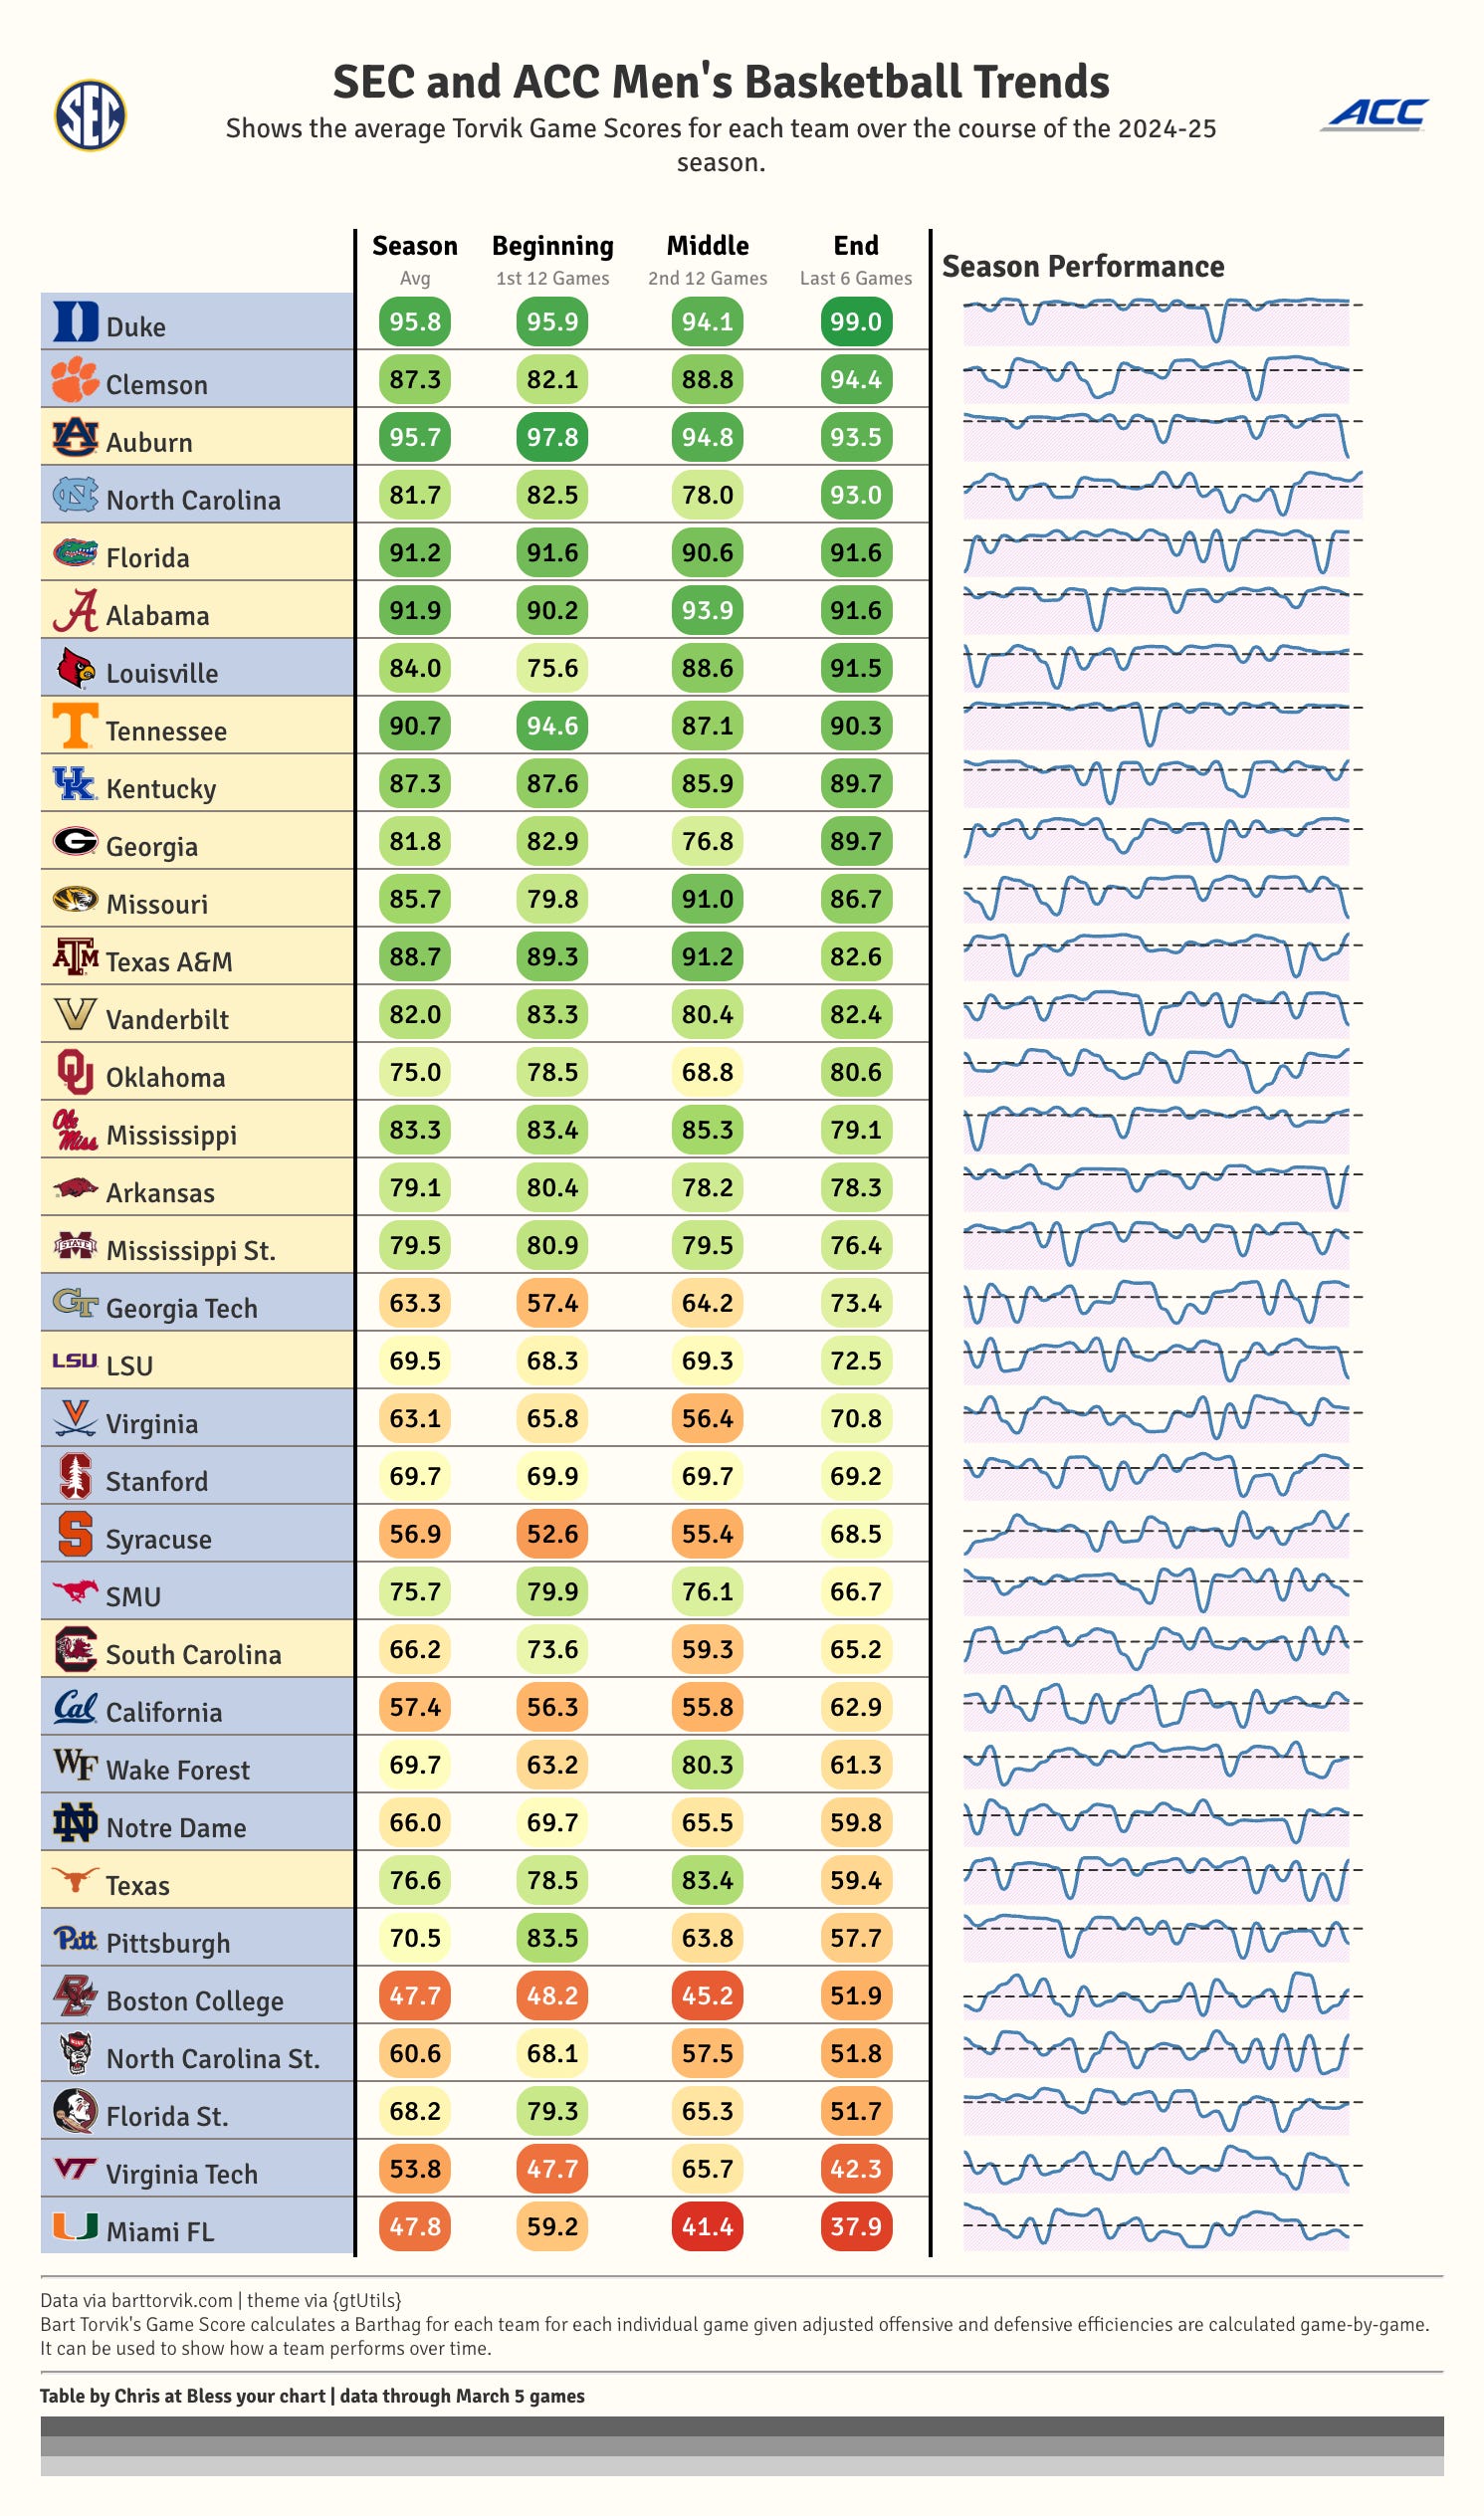
No surprise at the top of the table. Duke and Auburn have been the most consistent teams all season. The Blue Devils own a head-to-head win, albeit at home, against the Tigers in a funny twist4 to the narrative around the two leagues.
Other teams on this list are volatile like Georgia Tech and Texas. The Yellow Jackets have won eight of its last 11 games while Texas has lost seven of its last 10 games. The Longhorns average Game Score of 59.6 over its last six games ranks 28th out of these 34 teams.
What’s obvious from the chart is that the bottom of the ACC has been consistently below average all season, while the top of the SEC has been steadily above average. You probably didn’t need this chart to understand that just like you don’t need quadrant records to understand it either.
But what we should pay attention to here is the actual sample size.
What if these conferences had played their 34 cross-conference games in January or February instead of November and December? Would the results be the same?
The evidence suggests probably not. Because in these small samples of games, a lot can happen and change.
In the first 12 games, Pittsburgh’s 83.5 average Game Score ranked eighth out of the 34 teams in these two leagues, and behind only Duke in the ACC. The Panthers even debuted at 5th overall in the first NET rankings of December 1st and promptly lost by 33 points at Mississippi State three days later. Today, the Panthers are 61st in the NET after posting a 57.7 average Game Score over its last six games.
Louisville’s 75.6 average Game Score in the first 12 games ranks 21st out of the 34 teams. The Cardinals lost home games to Tennessee and Ole Miss by a combined 45 points, a neutral site game to Oklahoma by five points, and a road game to Kentucky by eight points.
Since January 1, Louisville has won 16 of 17 games ranking 11th overall using Bart Torvik’s numbers5. The Cardinals have an average Game Score of 88.6 over their last 12 games and 91.5 over their last six games.
Teams evolve throughout a season. Some improve dramatically while others decline.
Yet we base season-long narratives on games played mostly in the season's first six weeks, and Pomeroy’s point stands, we have no idea if conferences are improving or not after January 1.
This brings us to the bubble.
bUt ThE bUbBlE iS wEaK!
You can set your watch to the NCAA Tournament commentary that the “bubble is weak” around the end of February and early March. This has been going on for several seasons, see this article by Mike Rutherford from 2017.
First, teams on the bubble have warts. If they didn’t, they wouldn’t be on the bubble.
Second, how are we even reaching that conclusion? And what does it mean?
Let’s try to answer these questions and assess bubble strength over the past three seasons to this season.
In order to provide an answer, let’s use the NCAA’s official bracket seed list over the past three seasons and compare the power ratings via kenpom.com instead of the NET rankings. We’re using the official seed list, provided by CBS, from 2022, 2023, and 2024, pulling the lowest-ranked teams that earned an at-large bid.
We’re then showing the kenpom ratings and rankings from March 5 of that season. We’re intentionally avoiding using Selection Sunday numbers to provide a more accurate comparison to ratings for this season.
# Last 4 at-large teams in last 3 NCAA Tournaments
# Shows adjusted efficiency margin and rank from
# March 5th on the seasons date via kenpom.com
| Season   | Team                        | AdjEM | Rank |
|----------|-----------------------------|-------|------|
| 2021-22  | Wyoming (25-8)              | 13.08 | 54   |
| 2021-22  | Rutgers (18-13)             | 11.20 | 70   |
| 2021-22  | Indiana (20-13)             | 13.75 | 48   |
| 2021-22  | Notre Dame (22-10)          | 13.42 | 52   |
| 2022-23  | Mississippi St. (21-12)     | 14.66 | 45   |
| 2022-23  | Pittsburgh (22-11)          | 12.42 | 65   |
| 2022-23  | Arizona St. (22-12)         | 12.67 | 61   |
| 2022-23  | Nevada (22-10)              | 15.24 | 39   |
| 2023-24  | Colorado (24-10)            | 17.70 | 29   |
| 2023-24  | Virginia (23-11)            | 11.85 | 69   |
| 2023-24  | Oregon (23-11)              | 12.38 | 63   |
| 2023-24  | Colorado State (24-10)      | 17.03 | 36   |
Here is a list of current bubble teams using the kenpom ratings and rankings from March 5, 2025:
# Current Bubble Teams
# kenpom.com ratings as of March 5, 2025
| Team                   | AdjEM | Rank |
|------------------------|-------|------|
| North Carolina (20-11) | 18.32 | 38   |
| Arkansas (18-12)       | 17.76 | 39   |
| Oklahoma (18-12)       | 17.35 | 41   |
| Xavier (20-10)         | 17.22 | 42   |
| Texas (17-13)          | 16.82 | 44   |
| Boise State (22-8)     | 16.74 | 45   |
| SMU (22-8)             | 15.97 | 50   |
| Cincinnati (17-13)     | 15.64 | 53   |
| UC Irvine (25-5)       | 11.50 | 67   |
| Wake Forest (20-10)    | 10.38 | 79   |
Eight of this year's ten bubble teams have higher efficiency ratings than all but three teams that received at-large bids in the previous three tournaments.
This evidence suggests that, far from being weak, this year's bubble is likely stronger than the bubble of 2022 and either comparable to or stronger than last season's bubble. But we don’t know for sure as we’re over a week away from Selection Sunday and comparing season-to-season data leaves out a lot of context6.
This begs the question, what is the point of claiming the bubble is weak?
Is it to protect the sacred March Madness from expansion?
Or is it to validate our beliefs of conference strength?
Maybe it’s because we thrive on attention and we enjoy arguing?
The irony of March
The NCAA's decision not to share actual NET ratings (only rankings) and to exclude preseason priors makes us vulnerable to misinterpreting small sample sizes like those 34 ACC-SEC games. Without proper context, we lack the time and information to update our beliefs as the season marches on.
If North Carolina earns an at-large bid despite a rotten Quadrant 1 record, we'll blame name recognition and remind everyone how the ACC is so bad.
If Oklahoma makes the field with a conference record six games below .500, we'll cite the SEC's greatness.
And if Duke fails to win the national title despite historic efficiency metrics, we'll declare their season a failure.
Here lies the irony.
The NCAA Tournament itself celebrates the chaos of small sample sizes. Once the tournament begins, season-long sustainability is not a requirement for success. A team's performance over six games (or seven) in March matters more than everything that came before it.
The sport could eliminate much of this anxiety and discourse by disbanding its selection committee and adopting more objective qualification standards (like NCAA hockey's Pairwise system).
But college basketball doesn't want that. It thrives on the subjectivity and chaos, and we spend months debating it all.
It's March.
We're supposed to be mad.
Thank you for reading this far and hanging with me. As the bubble intensifies, you can find lots of data on all 364 teams in this tiny data app.
And if you found this useful or interesting or silly, please consider sharing it.
🤟 Happy March 🤟
You can find complete head-to-head conference records here.
The ACC went 14-1 against the Big South. Miami lost to Charleston Southern by four points on November 30. You can find a complete game log to see individual results here.
Perhaps an oddity, every team from the ACC and SEC has played exactly 30 games except one . . . North Carolina has played 31 games. My guess is the difference is from the game UNC played at Hawaii prior to the Maui Invitational.
The funniest twist, and it’s not likely to happen, is if Duke manages to lose its regular season finale against North Carolina combined with both Clemson and Louisville winning their final regular season games.
Duke would only win a share of the regular season title, and the Blue Devils would be the 3-seed in the ACC Tournament. This is all courtesy of Mred’s handy conference tournament tie breaker tool.
The top of the current kenpom ratings is particularly strong this season compared to past seasons. I do want to caution there is likely context missing when comparing the the adjusted efficiency metrics season-to-season. What aren’t we accounting for?