


130: Riding the shot volume TRAM
Introducing TRAM, a twist on Shot Volume Index (SVI).

Basketball is a simple game. A team wins by scoring more points than its opponent.
The team that is the most efficient with the ball wins. The building blocks of efficiency are shooting, rebounds, turnovers, and free throws. These four factors are measured by:
Effective field goal percentage (eFG%): shooting performance
Turnover rate (TO%): possessions lost
Offensive and defensive rebounding rates (OR%, DR%): second chances
Free throw rate (FTR): trips to the foul line
A team’s shooting performance is paramount to success. After all, you have to make shots to score points.
While rebounds and turnovers are independent of shooting, how do they influence scoring chances?
This brings us back to shot volume. John Gasaway1 shared some of the ways to calculate what is called shot volume last week. The blog post, with its curious title, covers the differences in shot volume measurements, such as Gasaway’s Shot Volume Index (SVI) and Hoops Insights’ Easy Hack method.
The rub is a method like SVI doesn’t actually produce the total number of shots, making its name somewhat misleading. SVI is useful, but what if we included all aspects of it and gave it a more literal name?
This involves a good chunk of math, so feel free to skip ahead.
Introducing TRAM
TRAM, or Turnover-Rebound-Adjusted-Margin, is an idea I’ve been considering while watching games and revisiting Gasaway’s work.
The goal is to measure a team’s advantage in scoring chances based on turnovers and rebounds. It won't predict which team will win with 100 percent certainty, but it can provide insight into a team's scoring chances.
The formula, derived from Gasaway's revised SVI, calculates the difference between a team's offensive and defensive shot volume to determine the margin. SVI estimates the number of field goal attempts per 100 platonic possessions. In this context, platonic refers to possessions independent of whether the shot is made or not.
This is computed for both a team’s offense and defense, swapping in the defensive rebounding rate and turnovers rates.
From here, we calculate the margin:
Turnovers (TO%) remove scoring chances. A team that turns it over will accumulate fewer true shot attempts2 and an opponent that turns it over has fewer chances to score. As Dean Smith explained in his book, Multiple Offense and Defense, we look at percent loss of ball versus the number of times we lose the ball. Tempo matters, and this is the turnover rate of both the offense and the defense.
Rebounds (OR%, DR%) create second chances. This is the rebound rate for both the offense and defense. As a continuation of Smith’s accounting for tempo, this is the team’s offensive rebounds divided by the opponent’s defensive rebounds plus the team’s offensive rebounds.
Adjustment comes from Gasaway. The mysterious - .561 - represents the likelihood of a shot attempt being a miss. The way we’re measuring possessions3, a rebound extends a possession, while a turnover eliminates a chance to score. In this sense, rebounds are more of a secondary factor or downstream from turnovers.
Margin is the difference between the offensive SVI and the defensive SVI. Something that always struck me about Dean Oliver’s work is his point to not forget that the four factors are for both the offense and the defense. While knowing one might give you the other, the margin here can help explain a team’s performance.
TRAM using 2024-25 data
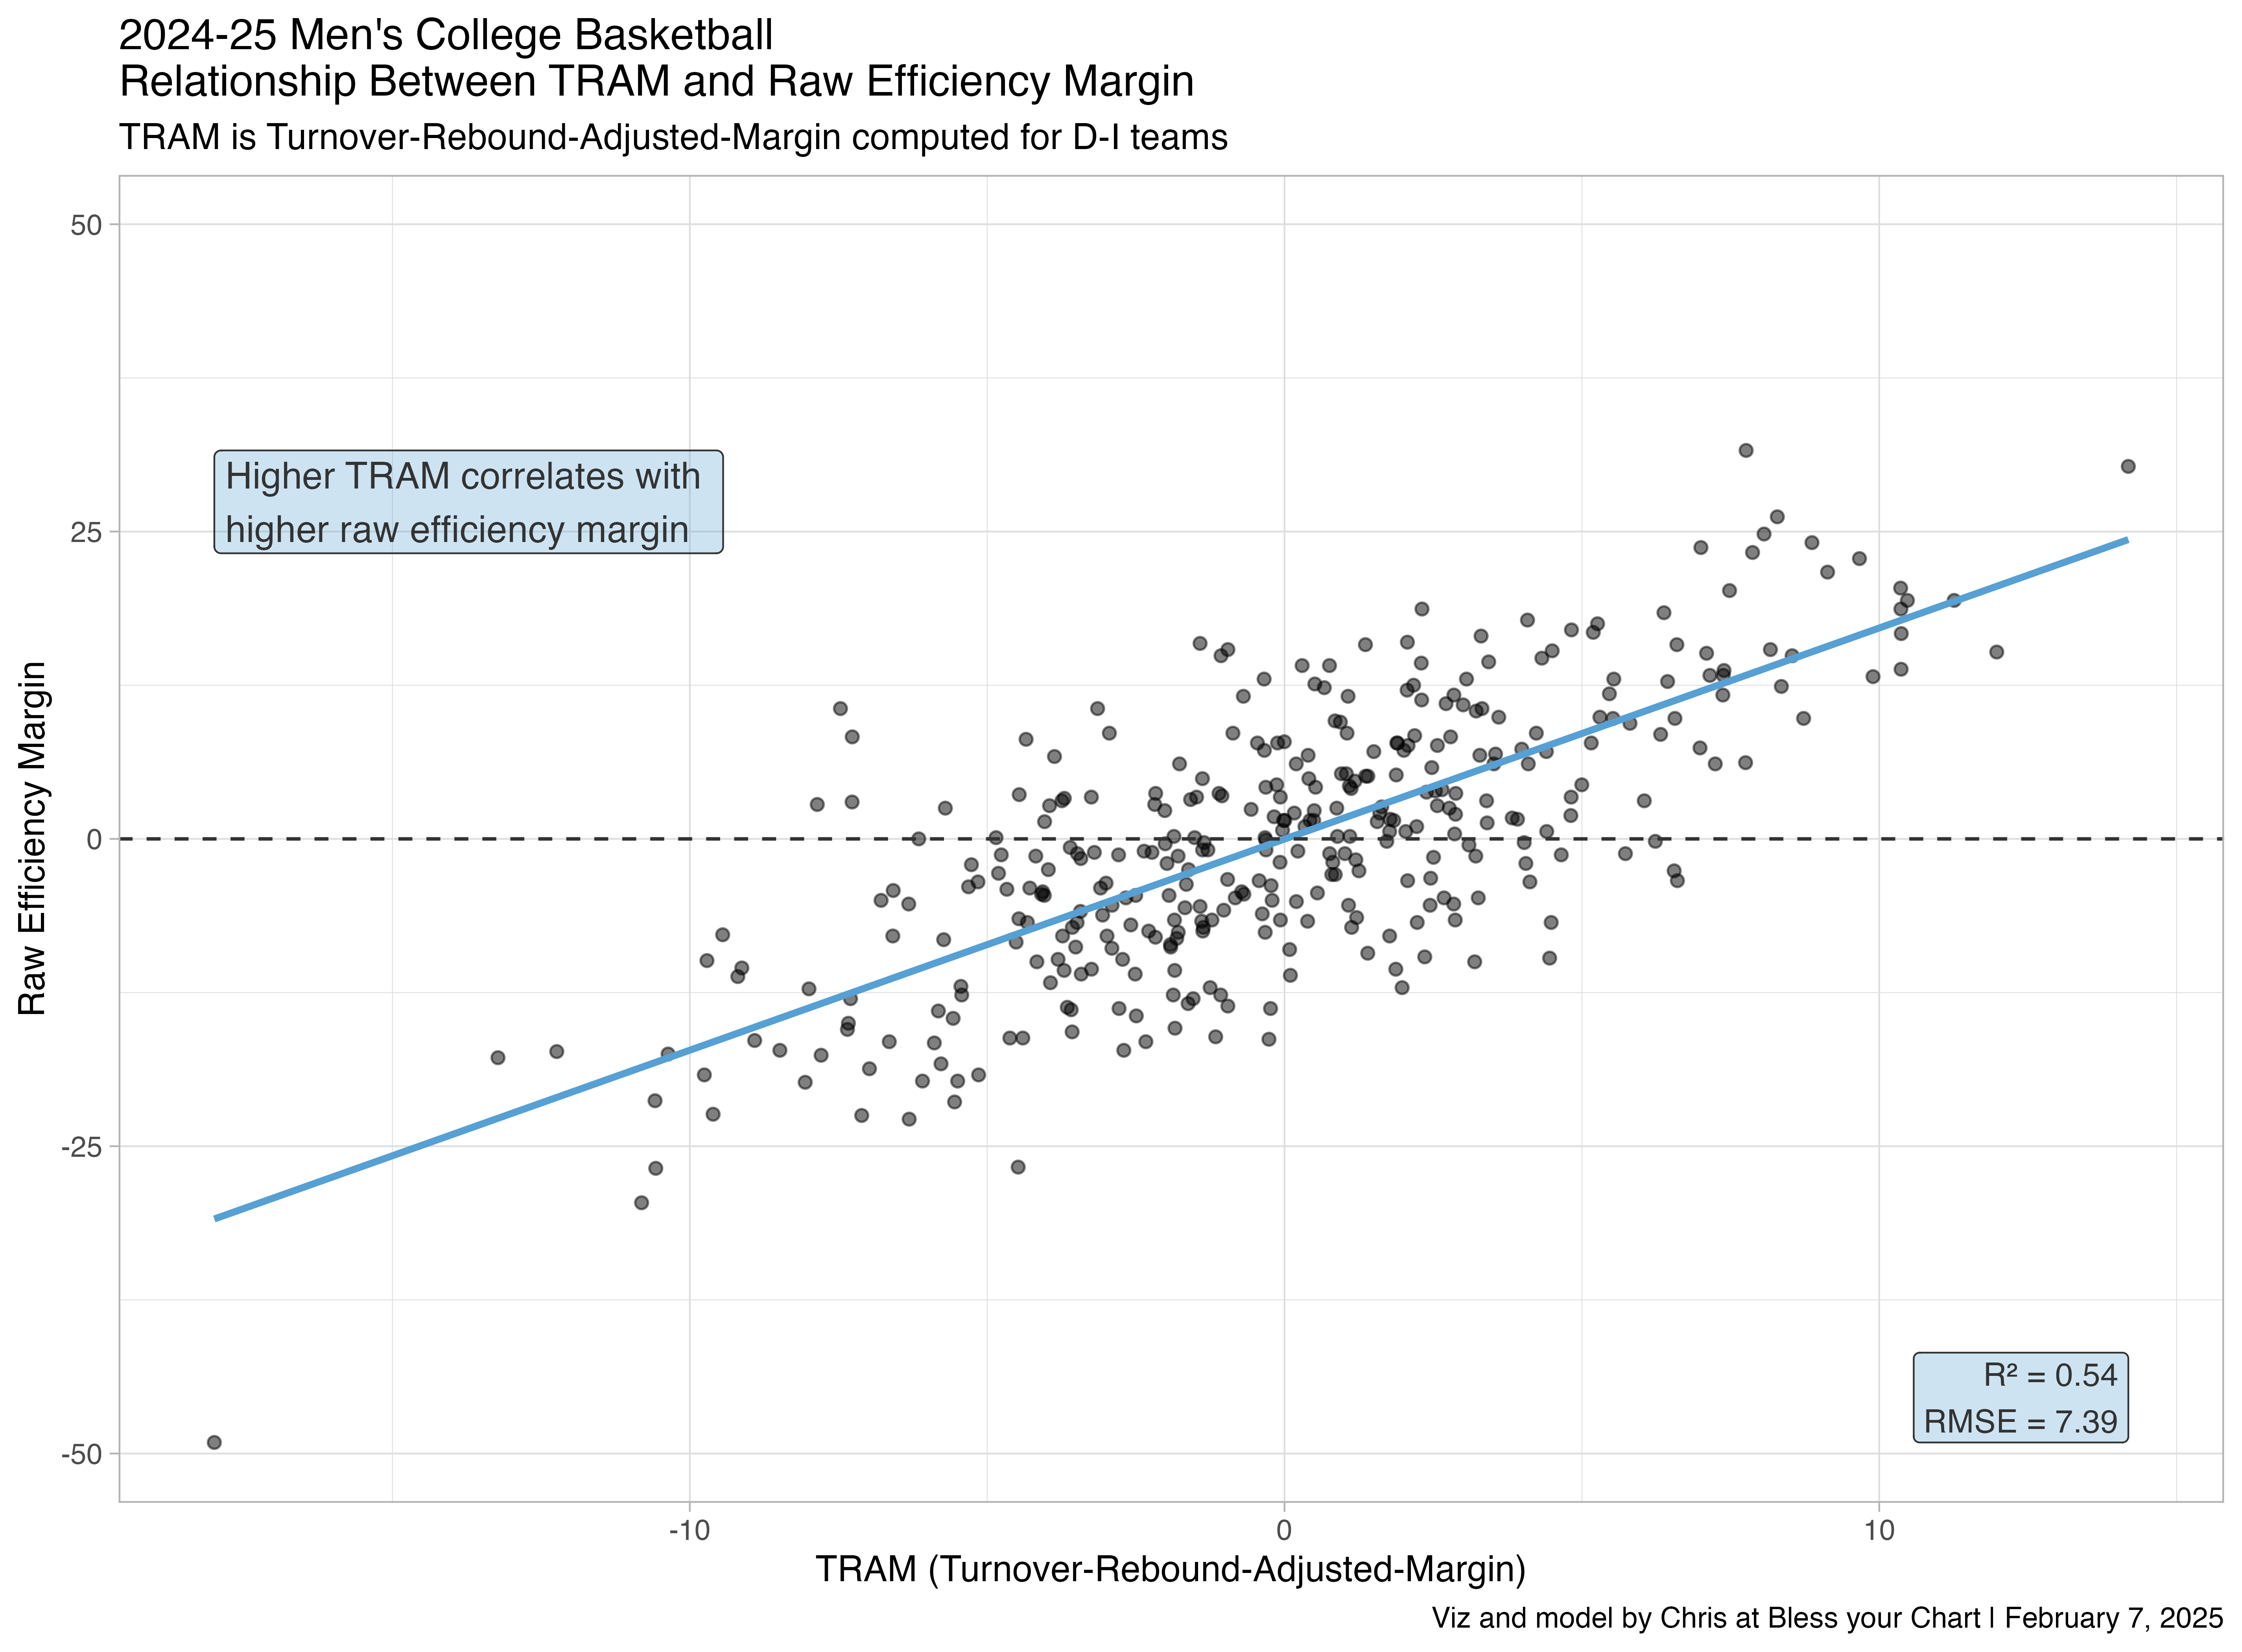
Using data from kenpom.com, I’ve calculated TRAM for teams through February 6 of the 2024-25 season. This data includes over 3,800 games between two Division-I teams.
In order to see if TRAM is useful to explain a team’s success, I’m measuring it against a team’s raw net efficiency per 100 possessions in the game. The difference between points per 100 possessions for both the team and its opponent, using the raw offensive and defensive efficiency.
The net efficiency is raw because it doesn’t adjust for opponent strength or location.
How does TRAM correlate to raw net efficiency on a per game basis?
If we try to predict4 raw net efficiency of a given team using TRAM, we find that raw net efficiency explains about 54 percent of a team’s success.
Teams that avoid turnovers, grab offensive rebounds, force turnovers, and prevent opponent rebounds improve their chances of winning.
The model is far from perfect, and some teams show significant prediction errors.
What are some examples of errors for certain teams?
While TRAM helps explain team success, some teams defy the model due to their unique strengths. Alabama and Creighton are both expected to have a worse raw efficiency margin when using TRAM as the predictor.
Creighton has a raw efficiency margin of 10.6 and TRAM predicts a margin of -12.8. It’s not hard to understand why the Bluejays fool TRAM - the team ranks 24th in offensive effective field goal percentage, 20th in defensive effective field goal percentage, and first overall in defensive free throw rate.
All of those shooting metrics show how TRAM can be tricked despite Creighton’s 360th ranking in defensive turnover rate and 305th ranking in offensive rebound rate.
Alabama has a turnover rate of 20 or higher in eight of its 22 games this season, and TRAM predicts a -1.7 raw efficiency margin. However, the Tide has an actual raw efficiency margin of 15.7 because they rank in the top 30 nationally in both offensive and defensive effective field goal percentage.
TRAM predicts both Seton Hall and Oklahoma State should be much better. The problem is these teams struggle to shoot effectively. The D-I average for eFG% is 50.1. Both teams are nowhere near that average on offense or defense:
Seton Hall 45.1 eFG% (offense) and 54.9 eFG% (defense)
Cowboys: 48.8 eFG% (offense) and 54.6 eFG% (defense)
Dean Oliver was right when projecting 40 percent of a team’s success comes from shooting and about 15 percent comes from free throw rate.

So, which teams have the best TRAM this season?
The 10 teams below do the best job of creating scoring chances and preventing opponent scoring chances through rebounds and turnovers. These are teams that are most likely to overcome poor shooting performances.
Through February 6 of this season, these 10 teams have won a combined 78.6 percent of their games (162-44 overall). All but two of the teams—Vanderbilt and UC San Diego—appear to be locks for the NCAA Tournament too.
Turnovers and rebounds alone won’t guarantee wins, but they tilt the odds in a team’s favor. TRAM shows how crucial these factors are in improving scoring chances. If nothing else, TRAM serves as another way to appreciate how teams manufacture wins beyond just shooting percentages.
If you read this far, thank you. This was an attempt to try something a little different this week, apologies if its was a bit too dense. The footnotes include some recommendations and notes that helped me write this post.
Here is the code for the charts and graphs, plus a GitHub gist with the data used to generate the model.
And if you’re looking for more college hoops data this season, check out this tiny app that surfaces a bunch of different team metrics.
Like and subscribe for more shenanigans, and happy Friday.
Embracing the idea that great artists steal, this post borrows a lot of Gasaway’s generous ideas. He has a splendid newsletter, Now and Again, that is fun to read. His latest post mentions the Sawatsky method of interviewing, which is something I wish we all tried to learn.
Nathan Walker’s rudimentary analysis of offensive efficiency is something I repeatedly revisit. More shot attempts reduce turnovers and more turnovers reduce shot attempts.

Note that Dean Smith measured possessions where a rebound would create a new possession or chance to score.
This uses a simple linear model. I’ve been reading Analyzing Baseball Data with R and I’m following a lot of the same methods in this chapter. I’m not a trained statistician, but this has been a useful resource to practice some exploratory data analysis.