118: Sankey and shot volume
A Sankey diagram of college football rankings and a check-in on Carolina's shot volume.
As college hoops bleeds into last stanza of college football season, here are a couple visualizations across both sports.
Greg Sankey chart 🏈
The second iteration of the college football rankings were revealed last night. Here is a list of the CFP rankings compared to ESPN’s SOR (strength of record) rankings and Fremeau’s GWD rankings.
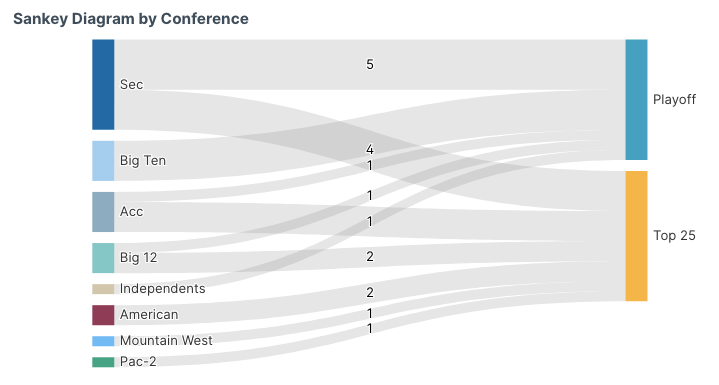
Below is a Sankey diagram showing the number of teams by conference ranked in the top 12 (Playoff) and the number of teams ranked in the top 25 (13th to 25th).
The SEC has nine total teams in the top 25 and five of those teams are ranked in the top 12. This includes Georgia that fell from the third overall ranking to 12th. The Bulldogs qualify as the first team out because Boise State, ranked 13th, automatically qualifies as the best team from a Group of 5 conference.
If the seeding and format sounds confusing, you’re right!
It’s clear that the SEC is the most time-affluent conference amongst all college football. The teams in the SEC can absorb losses and gain “quality” wins at a rate that no other conference can afford. The margin of error is wide.
Consider there are only two teams ranked in the top 25 with a negative point differential in conference play. Both are from the league where it just means more:
LSU, 22nd (3-2 in SEC with -14 point differential)
Missouri, 23rd (3-2 in SEC with a -52 point differential)
The lines remain blurred if the committee is aiming for a predictive rating or ranking teams based on résumé. The answer seems to involve both predictive rating and résumé-based ranking, which explains the confusion.
We don’t have to spend a ton of time debating the rankings or claiming it’s a travesty, there is a lot of ball left to be played. There were even three games last night, including Buffalo beating Ball State 51-48 in overtime.
You can find more data like spreads and totals, team ratings, playoff rankings, and conference standings here:
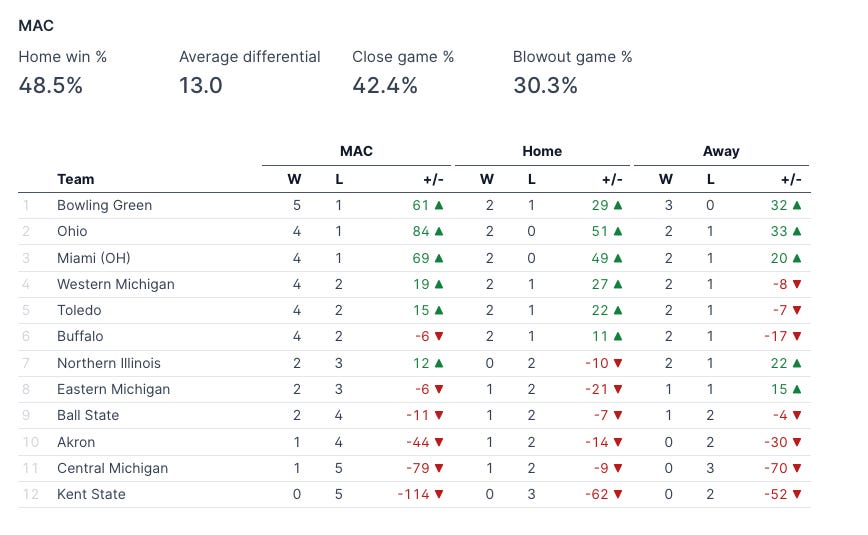
For example, here are the current MAC standings after last night's games:
🏀 Shot volume early returns
A question I asked last week was around North Carolina’s shot volume:
Given North Carolina’s personnel, will the team’s pace and space style be as effective as the old shot volume style of the past?
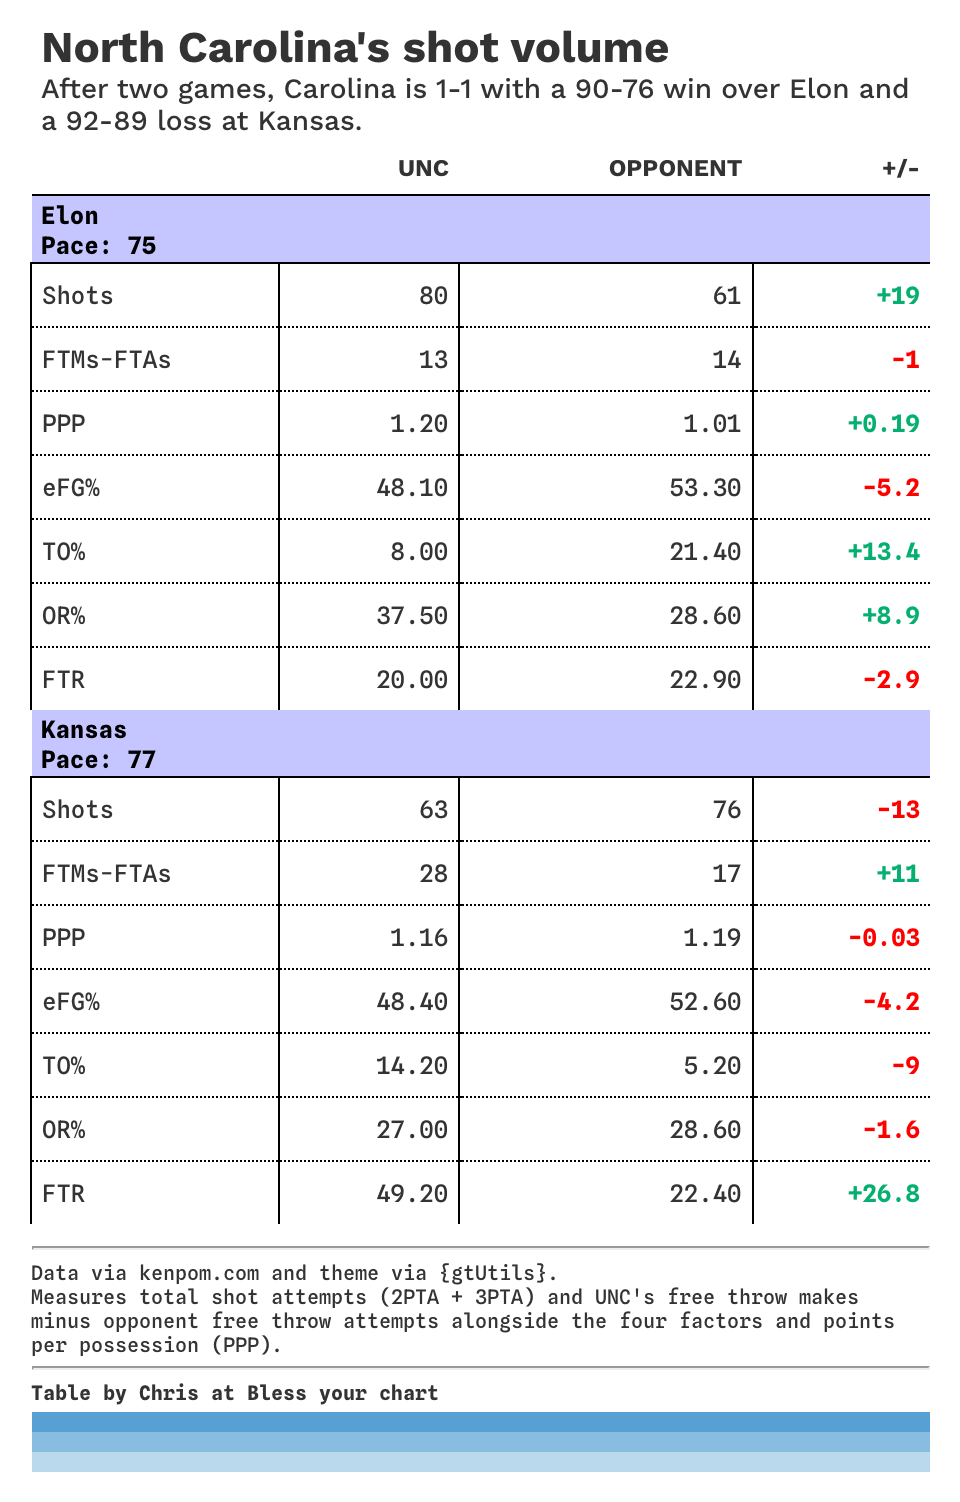
This chart surfaces the early returns through two games. Given this is only two games worth of data, it shows the total shot differential (total attempts from twos and threes) and the difference in Carolina’s made free throws and opponent attempts1 alongside points per possession and the four factors.
The drivers of shot volume are turnovers and rebounds. Both can reveal how a team is able to earn extra chances to score.
Carolina scored 1.20 points per possession with a sub-optimal 48.1 effective field goal percentage in its win over Elon. The Heels attempted 80 shots, 19 more than the Phoenix. Carolina rebounded 37.5 percent of its missed shots and avoided turnovers on nearly 92 percent of its possessions to overcome its shooting performance, and win the game by 14 points.
Against Kansas, the Jayhawks avoided turnovers at an alarming clip2. Kansas committed only four turnovers in 77 possessions. 95 percent of possessions being turnover-free is the fourth best mark by a Carolina opponent in the kenpom era or since the 1997 season. That’s almost a ~1000 game sample size.
Carolina matched Kansas on the boards as both teams rebounded about ~28 percent of their missed shots. The Heels turned it over seven more times than Kansas, and it explains why the Jayhawks attempted 13 more shots given just 86 percent of UNC possessions were turnover-free.
Advantages
In his new book, Basketball Beyond Paper, Dean Oliver explains an offense creates advantages in three ways:
Spacing or screening
Establishing mismatches
Creating confusion
Carolina made 28 free throws to Kansas’ 17 free throw attempts. The +11 margin nearly made up for the Carolina’s carelessness with the ball or almost made up the -13 difference shot attempts.
What stood out from those free throw attempts is 27 of Carolina’s 31 attempts came from its guard trio of Elliot Cadeau, RJ Davis, and Seth Trimble. A friend that is far smarter than me pointed out that doesn’t happen without space to attack and get to the rim as Carolina moves on with life after Armando Bacot.
Carolina has shown ability to gain advantages through playing five-out with space, plus the Heels can push the pace to establish mismatches and create confusion. It’s encouraging to see UNC score 1.16 and 1.20 points per trip while posting an effective field goal percentage below 50.
The advantages Carolina creates on offense come with tradeoffs on the defensive end of the court. Oliver shares in his book that everyone hates defense because defense measures the accumulation of nothingness.
Both Elon and Kansas have performed above the D-I average of 50.4 effective field percentage this season. Kansas scored 57 percent of its points in the paint in the first half against UNC too.
Moving forward, it'll be fascinating to track Carolina's shot volume incorporating both pace and free throw rates. This old John Gasaway metric3 continues to give us a window into teams built to win different ways.
The early returns show this team can create edges that come with defensive tradeoffs, but when your offense can remain efficient even on below average shooting nights, there might be something there.
Thanks for reading this far, and please subscribe if you so choose. You can find the code for the chart and more college football data in this app.
This is an old Dean Smith and Roy Williams metric I’ve heard referenced a ton.
Think not forcing turnovers is a feature, not a bug, of a Hubert Davis’ coached defense. UNC has ranked in the 300s across all D-I teams in defensive turnover percentage in every season under Davis thus far.
Old Gasaway blogs are this week’s recommendation 🫡


