"Some people claim the schedule is unfair," he said. "You're always going to hear that because it can't be equal anymore. We're so used to equality with a double round-robin that this is a whole new ballgame. It's never going to be equal again."
In 2005, the late ACC associate commissioner Fred Barakat explained how the league’s scheduling would never be equal again.
Prescient.
If conference schedules are not equal, how can we assess the strength of a team’s conference schedule?
I’ve tried to assess a team’s strength of schedule in league play in the past. You can use a variety of rankings to do so, but today we’re going to use WAB or wins-above-bubble.
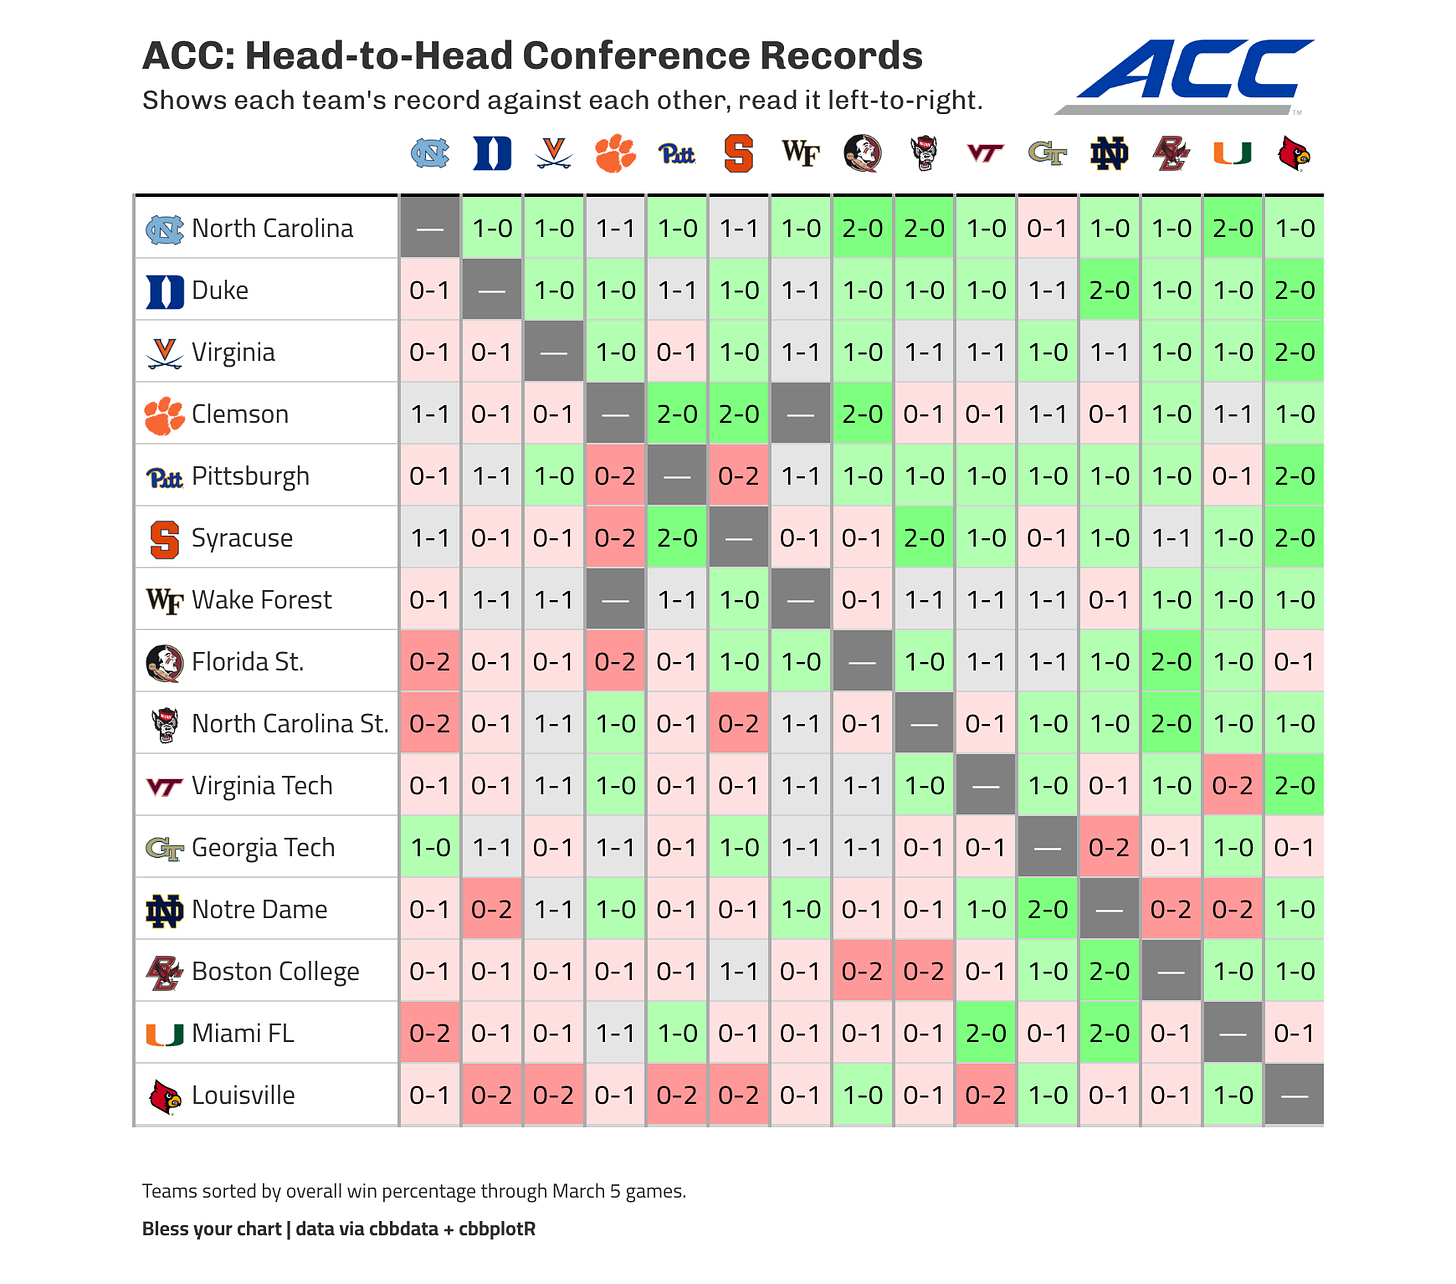
Before we do that, let’s look at a head-to-head matrix of all ACC games through March 5. How to read this graphic1:
teams are sorted by winning percentage as of March 5 games
records are from left-to-right by opponent
no location or point differential shown, only head-to-head records
First, the teams or schools don’t pick their league schedule. If so, I’m sure all teams would request to play Louisville twice.
Next, keep in mind that when assessing a team’s strength of schedule, the specific team can’t play themselves. Louisville is nearly a lock to play against the toughest conference schedule for this reason.
Enough of picking on Louisville.
How do use you use WAB for conference schedule strength?
The idea is to first establish a baseline team in the league. In this exercise, Syracuse is the median team for the ACC2.
So, how would Syracuse be expected to perform against each team’s schedule?
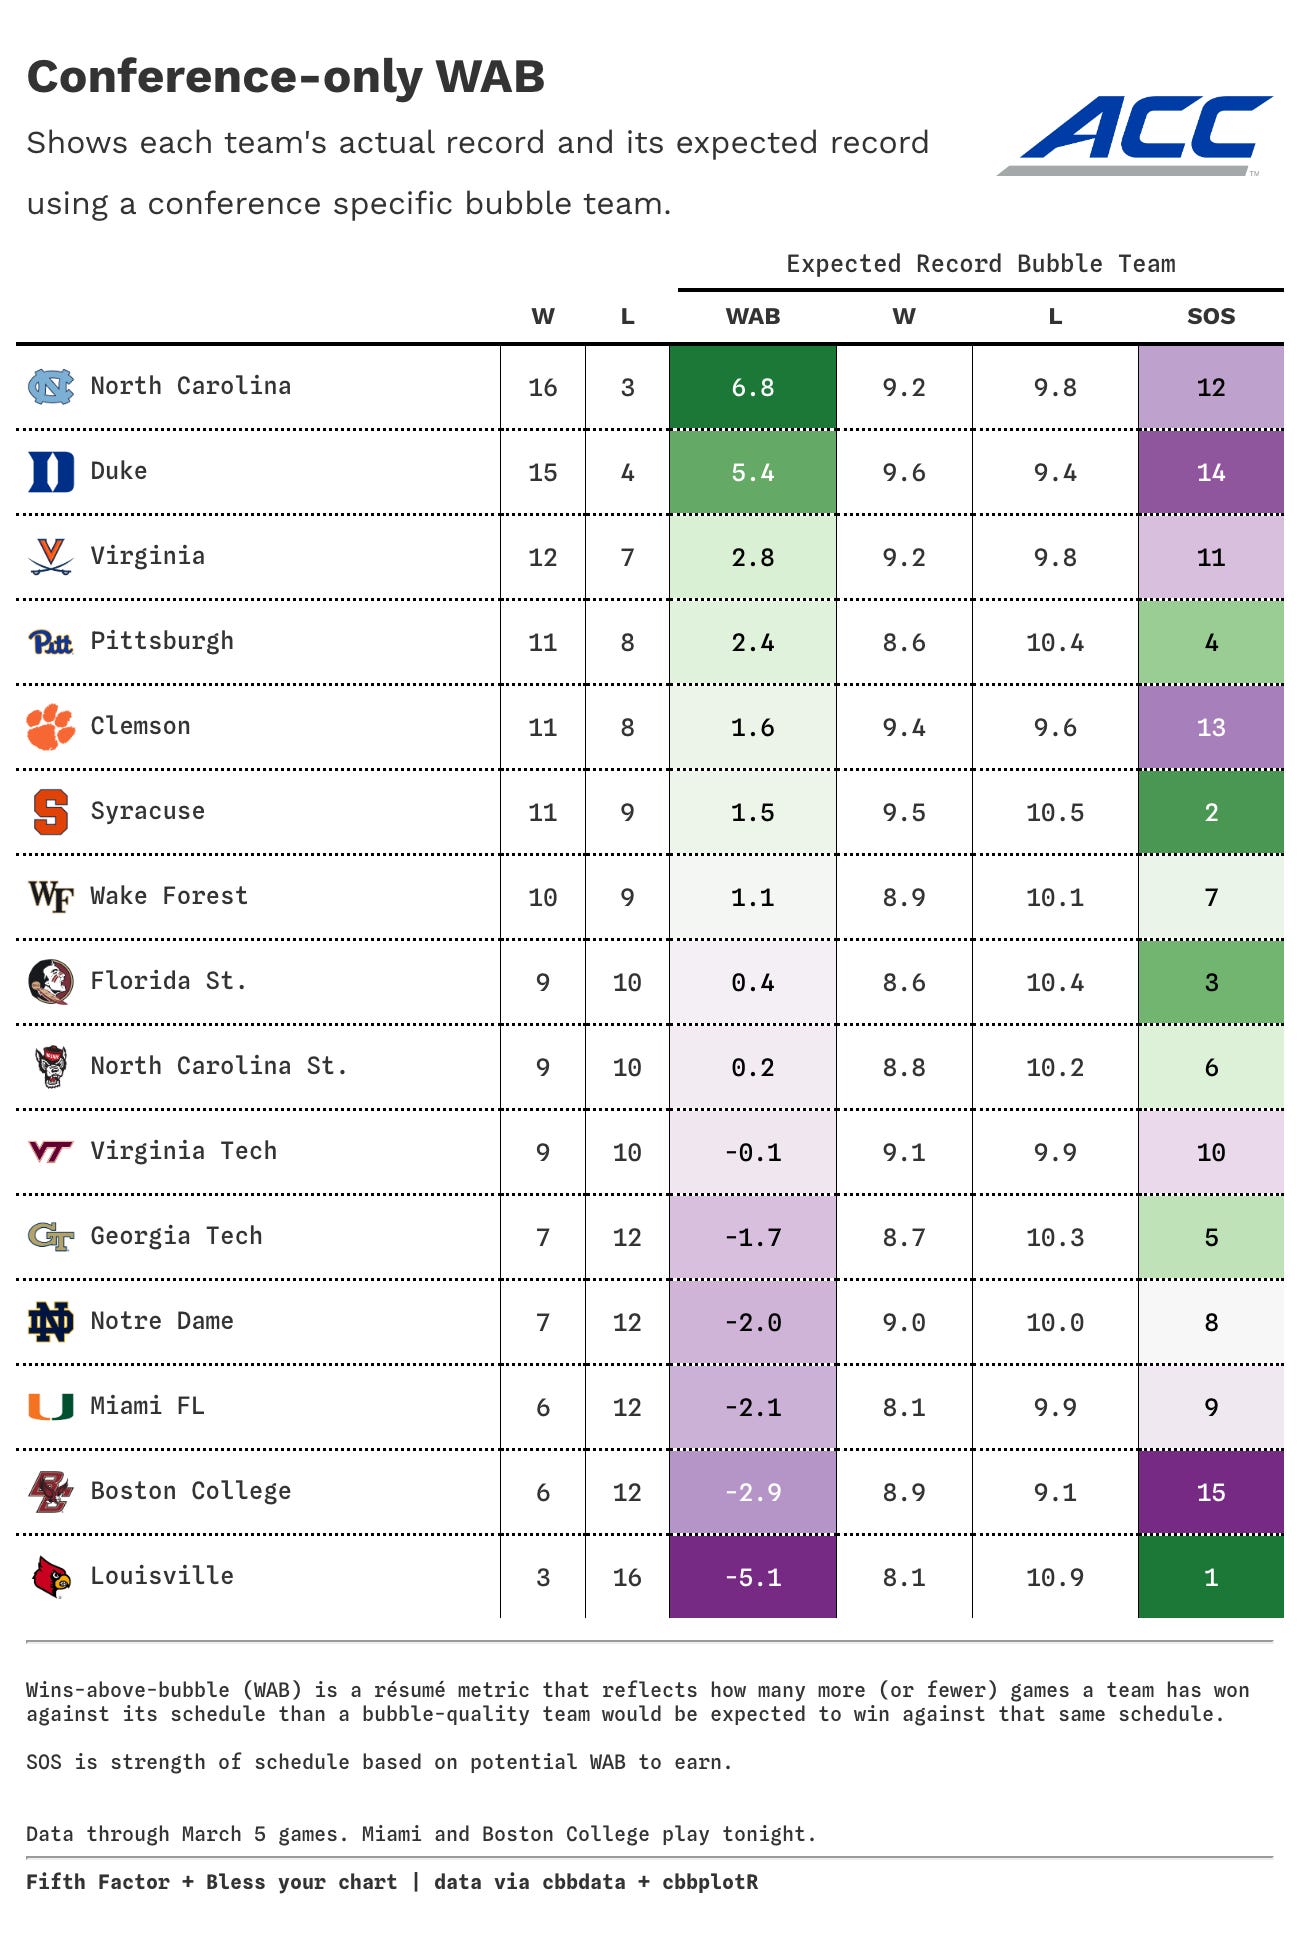
This gives you an idea of the “bubble” or “baseline” expected record. The difference in how many games a team won and how many a “bubble” team would win is calculated for each team’s WAB.
For example, Syracuse would be expected to go around 10-9 against Duke’s conference schedule, specifically 9.6 wins. The Blue Devils have won 15 games, so the WAB is +5.5 or the difference between the projected (9.6) and actual (15) wins.
We can use potential WAB to gain to define a crude strength of schedule metric. The fewer wins a "bubble" team would pick up against your schedule, the tougher it is3.
The schedule for Duke in league play is fortunate. The Blue Devils drew Virginia, Syracuse, and Clemson once each and only at home4. Duke’s double round-robin opponents are at the bottom of the league: Louisville, Georgia Tech, and Notre Dame.
This is why a "bubble" team would be expected to go 9.7-9.3 against Duke's schedule, but 7.7-10.3 against Louisville's schedule.
Of course, this doesn’t mean the Blue Devils aren’t one of the best teams in the league and it doesn’t mean Louisville isn’t one of the worst teams in the league.
The best kind of tie breaker is no tie breaker
When it comes to breaking ties and teams are playing unequal schedules, we should be skeptical. It would be great to see the league take some, or any, measure of schedule strength into account.
In a true double round-robin or balanced schedule, you likely don’t need to factor in any sort of strength of schedule. Because in the scenario that all teams play each other twice, a strength of schedule metric could reward the weaker team.
The problem is ACC will probably never play an equal or balanced schedule again. It hasn’t since the 2003-04 season.
Right now, the league uses the higher win percentage to break ties even if the number of games played against a team or group is unequal. A comparison of a 1-0 record and 1-1 record to decide ties is a bit of a boondoggle.
Are we sure there is a significant advantage to winning a tie breaker to be the 1 seed instead of the 2 seed?
Maybe its better to play at noon on Thursday instead of 7 pm?
But are the matchups favorable?
Tiebreakers are probably less consequential when it comes to the number one or number two overall seeds in the conference tournament. These tiebreakers can have massive impacts when considering the top four teams receive a double-bye5. There is a tangible advantage to having an extra day of rest and playing one fewer game to win a tournament.
All of this will get even more complicated next season when Cal, Stanford, and SMU join the league. Only the top 15 teams will make the conference tournament. Imagine the tiebreakers between teams 15 or 16 for the right to even participate in the ACC Tournament.
It’s a challenge to schedule games in this era of college athletics. Given the narratives around the ACC and the complaints that other leagues are gaming the metrics, the ACC should consider more creative scheduling practices in the future.
Big thanks to Ryan Campbell for helping compute the conference WAB totals and suggesting ways to explain this information. Give Ryan a follow (@5th_Factor), especially ahead of the NCAA Tournament.
And if you haven’t already, subscribe for future posts.
This graphic has lots of logos, so it can take some time to digest. Somewhat related, seen lots of people complain about logo graphics lately, which makes me hesitant to share this one. It was inspired by Luke Benz’s Ivy League graphic, which works better given fewer teams in that league.
Ryan Campbell, @5th_Factor, determined the median team strength using barttorvik.com via cbbdata. This is not to be confused as the team with a .500 conference record, but the team that is in the middle of the league from a ratings standpoint.
Keep in mind all but two teams (Boston College and Miami) have played 19 of 20 regular season games. The data will change after tonight’s game between those two teams.
Shame that those teams ticket offices didn’t benefit from Duke visiting their venues this season. What a odd thing to share from the main account.


