052: 🏈 Spurtability of FBS teams
A look at defining spurt drives for both offense and defense.
Last season, the North Carolina defense gave up 17 plays from scrimmage of 40 plus yards. Through the first six games this season, the Tar Heels have allowed two plays from scrimmage over 40 yards by its opponents.
Big plays make a difference. If plays are the components of drives or possessions, how can we categorize big drives?
Introducing spurtability
This riffs off how Rob Bowmon defines explosive drives or drives that average more than 7.5 yards per play. I’m calling these drives spurts instead of explosives1.
Using data from games between two FBS teams this season, ~79 percent of these drives that average 7.5 yards per play or more end in a touchdown. This doesn’t adjust or filter out any garbage time drives.
About six percent of spurts end in a field goal, and a surprising ~15 percent end without any points at all.
Spurtability is an experiment in measuring the points per these types of drives for both the offense and defense.
Take Duke as an example.
Duke offense
16 drives averaging 7.5 yards per play or more
13 touchdowns (6 x 13 = 54 points)
2 field goal (3 x 2 = 6 points)
1 empty (1 x 0 = 0 points)
Duke defense
10 opponent spurts
3 touchdowns (6 x 3 = 18 points)
0 field goal (3 x 0 = 3 points)
7 empty (7 x 0 = 0 points)
The spurtability score is the difference in points per spurt between the offense and defense. The caveat is we’re trying to normalize the number of drives or spurts.
When comparing these numbers across all FBS teams, I’m trying not to be too sensitive to outliers like Southern Mississippi’s six points per spurt on offense (eight total spurt drives and eight touchdowns).
So, for this reason, I’m using a logarithm of the number of drives across all FBS teams.
Here is the look at the top-15 teams in spurtability.
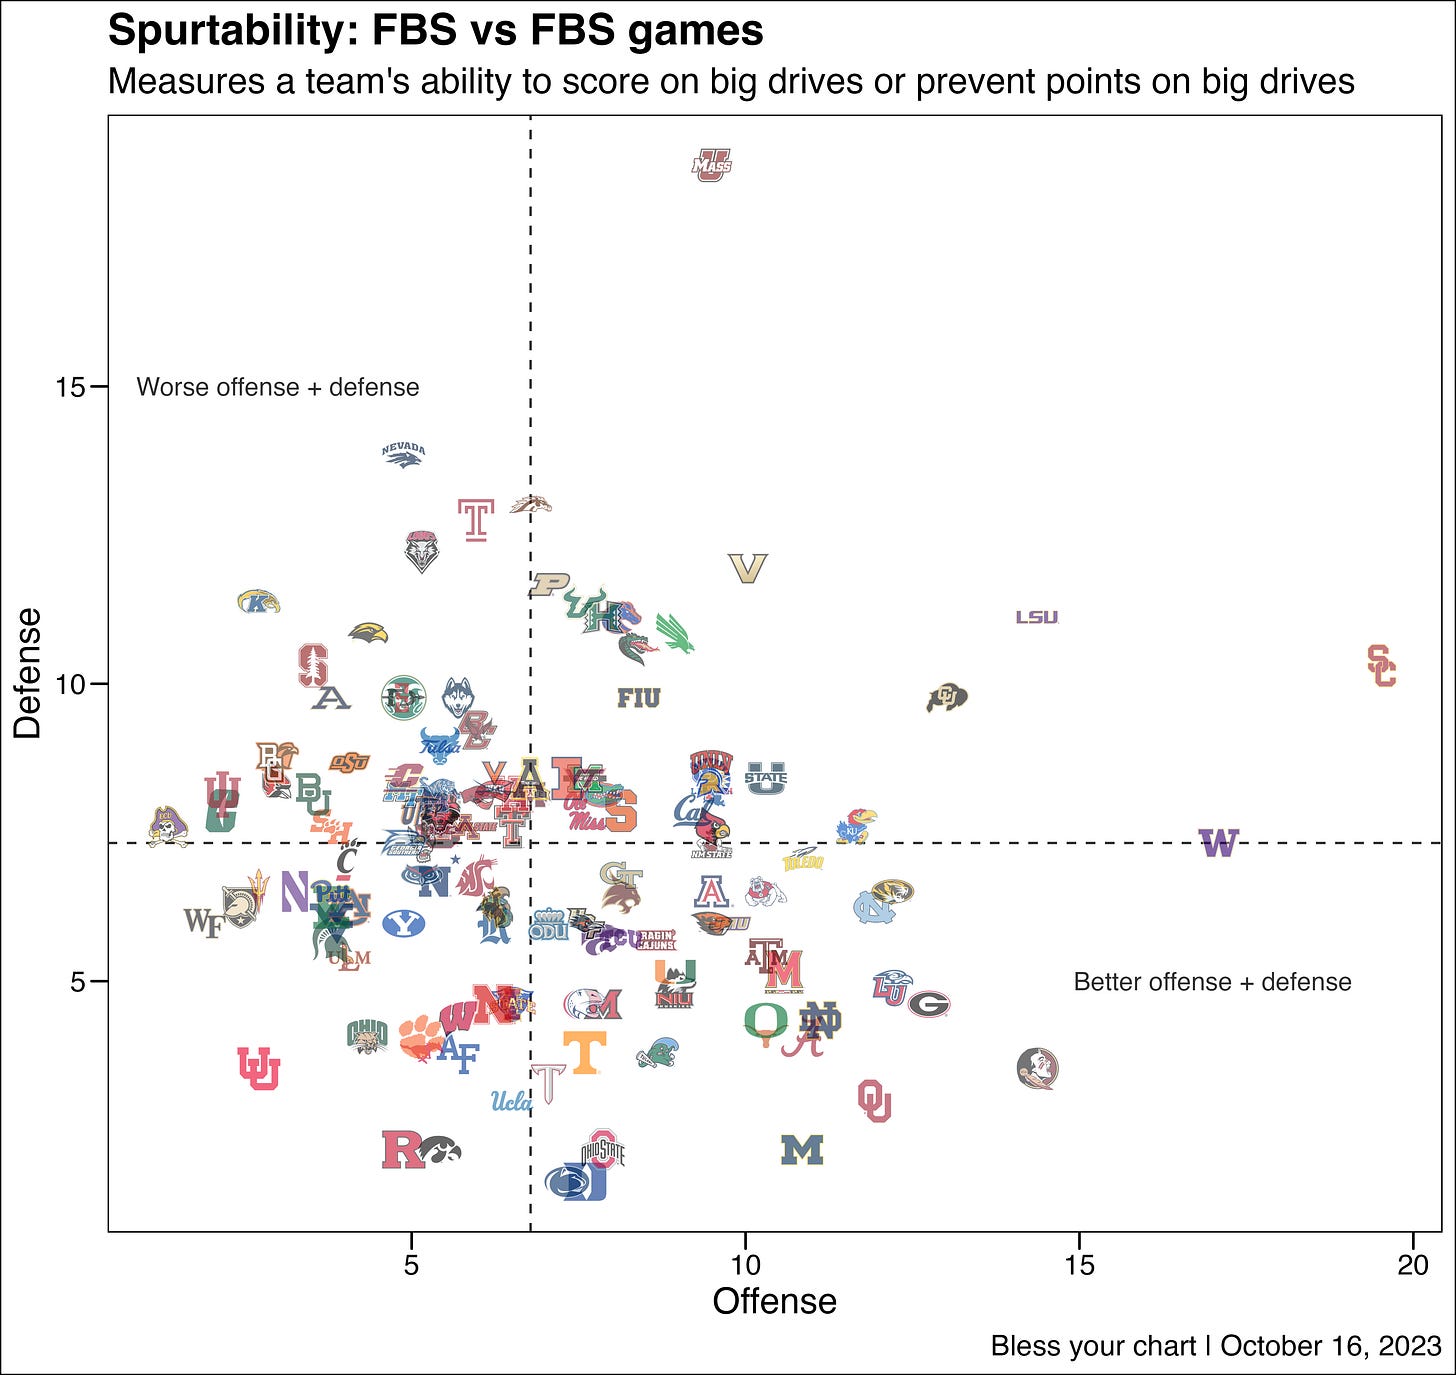
Florida State has scored 26 touchdowns on its 27 spurts on offense. The Seminoles defense has allowed 12 spurts, but opponents have only scored six touchdowns on those drives. This explains why Florida State leads all FBS teams in spurtability.
While Duke’s offense doesn’t create a ton of spurts, it’s defense prevents spurts and opponents are not scoring on those spurt drives2.
Here is a look at all FBS teams in spurtability:
Back to North Carolina’s defense
North Carolina’s offense has created 10 more spurts (24) than its defense has allowed (14). This is a key reason why its 6-0 in mid-October.
In the 2022 debacle in Boone, the Tar Heel defense gave up eight spurts - drives of 7.5 yards per play or more - in that single game. The defense this season has only allowed 10 spurts over six games.
Consider North Carolina allowed 40 points in the fourth quarter to Appalachian State in that game. This season, the Carolina defense has allowed 27 total points in across six fourth quarters.
Still trying to predict game duration
After watching North Carolina and Miami’s penalty fest, I’ve added a couple more variables to trying to predict the length of games.
Combined penalties and incompletions.
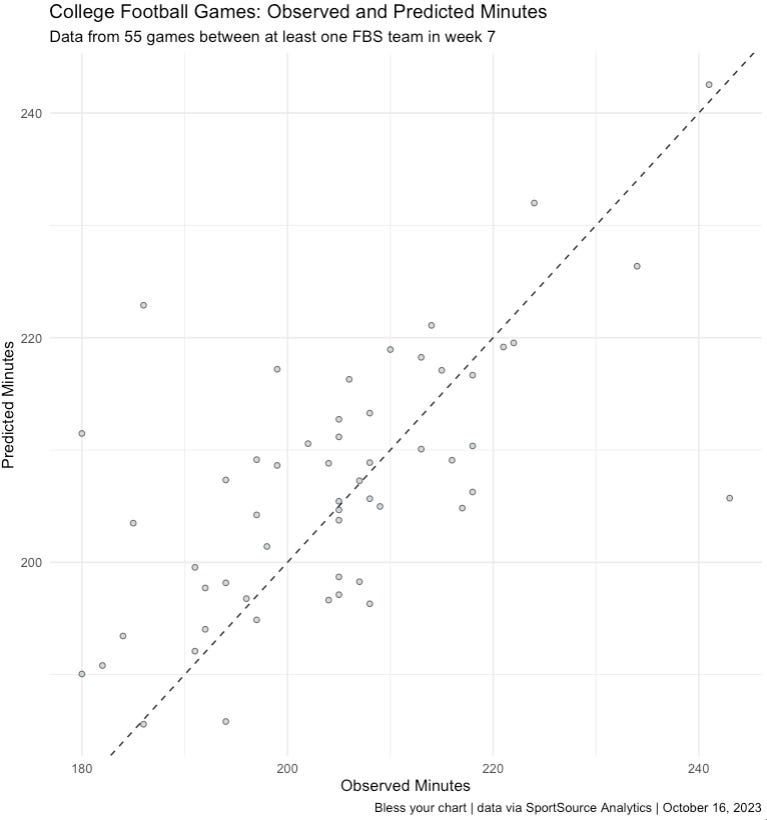
Here is how the model from last week compares to game duration for week seven games only:
It feels a bit more accurate, but still struggling to adjust for lengthy reviews and other variables. As a reminder, you can find a log of all games this season with duration, offense plays and drives, and more here: fbs-logs.blessyourchart.com
The word explosives has always felt like an odd way to describe big plays to me. Not a fan of calling scoring runs - kill shots - either. I get hockey uses penalty kills too. I think we can use better words to describe these things. Now watch a Spurtle commercial.
Clemson had three drives against Duke that averaged 7.5 yards per play or more. The Tigers did not score on any of those spurt drives.


