
180: Scrutinizing the standard
Plus a look at the Sweet 16.

After North Carolina blew a 19-point second-half lead to VCU in the first round of the NCAA Tournament last week, the conversation surrounding the future of the program’s head coach shifted from if to when. A coaching change is expected at any moment.
This has led to all sorts of opinions and narratives. And every argument is a circular argument if you try hard enough.
The loop that has drawn my attention keeps coming back to the same three questions: Is this the standard? Has the standard slipped? What is the standard?
If we’re asking these questions, it’s probably already too far gone. But in the spirit of this newsletter, let’s look at actual data and try to make sense of it.
The historical standard
When people say standard, I think they mostly mean consistency. The expectation was a program at the top of the sport, year in and year out.
SRS, simple-rating-system, from Sports Reference, rates teams using average point differential and strength of schedule. We have data going back to 1960, and it gives us the longest, cleanest look at Carolina basketball’s history.
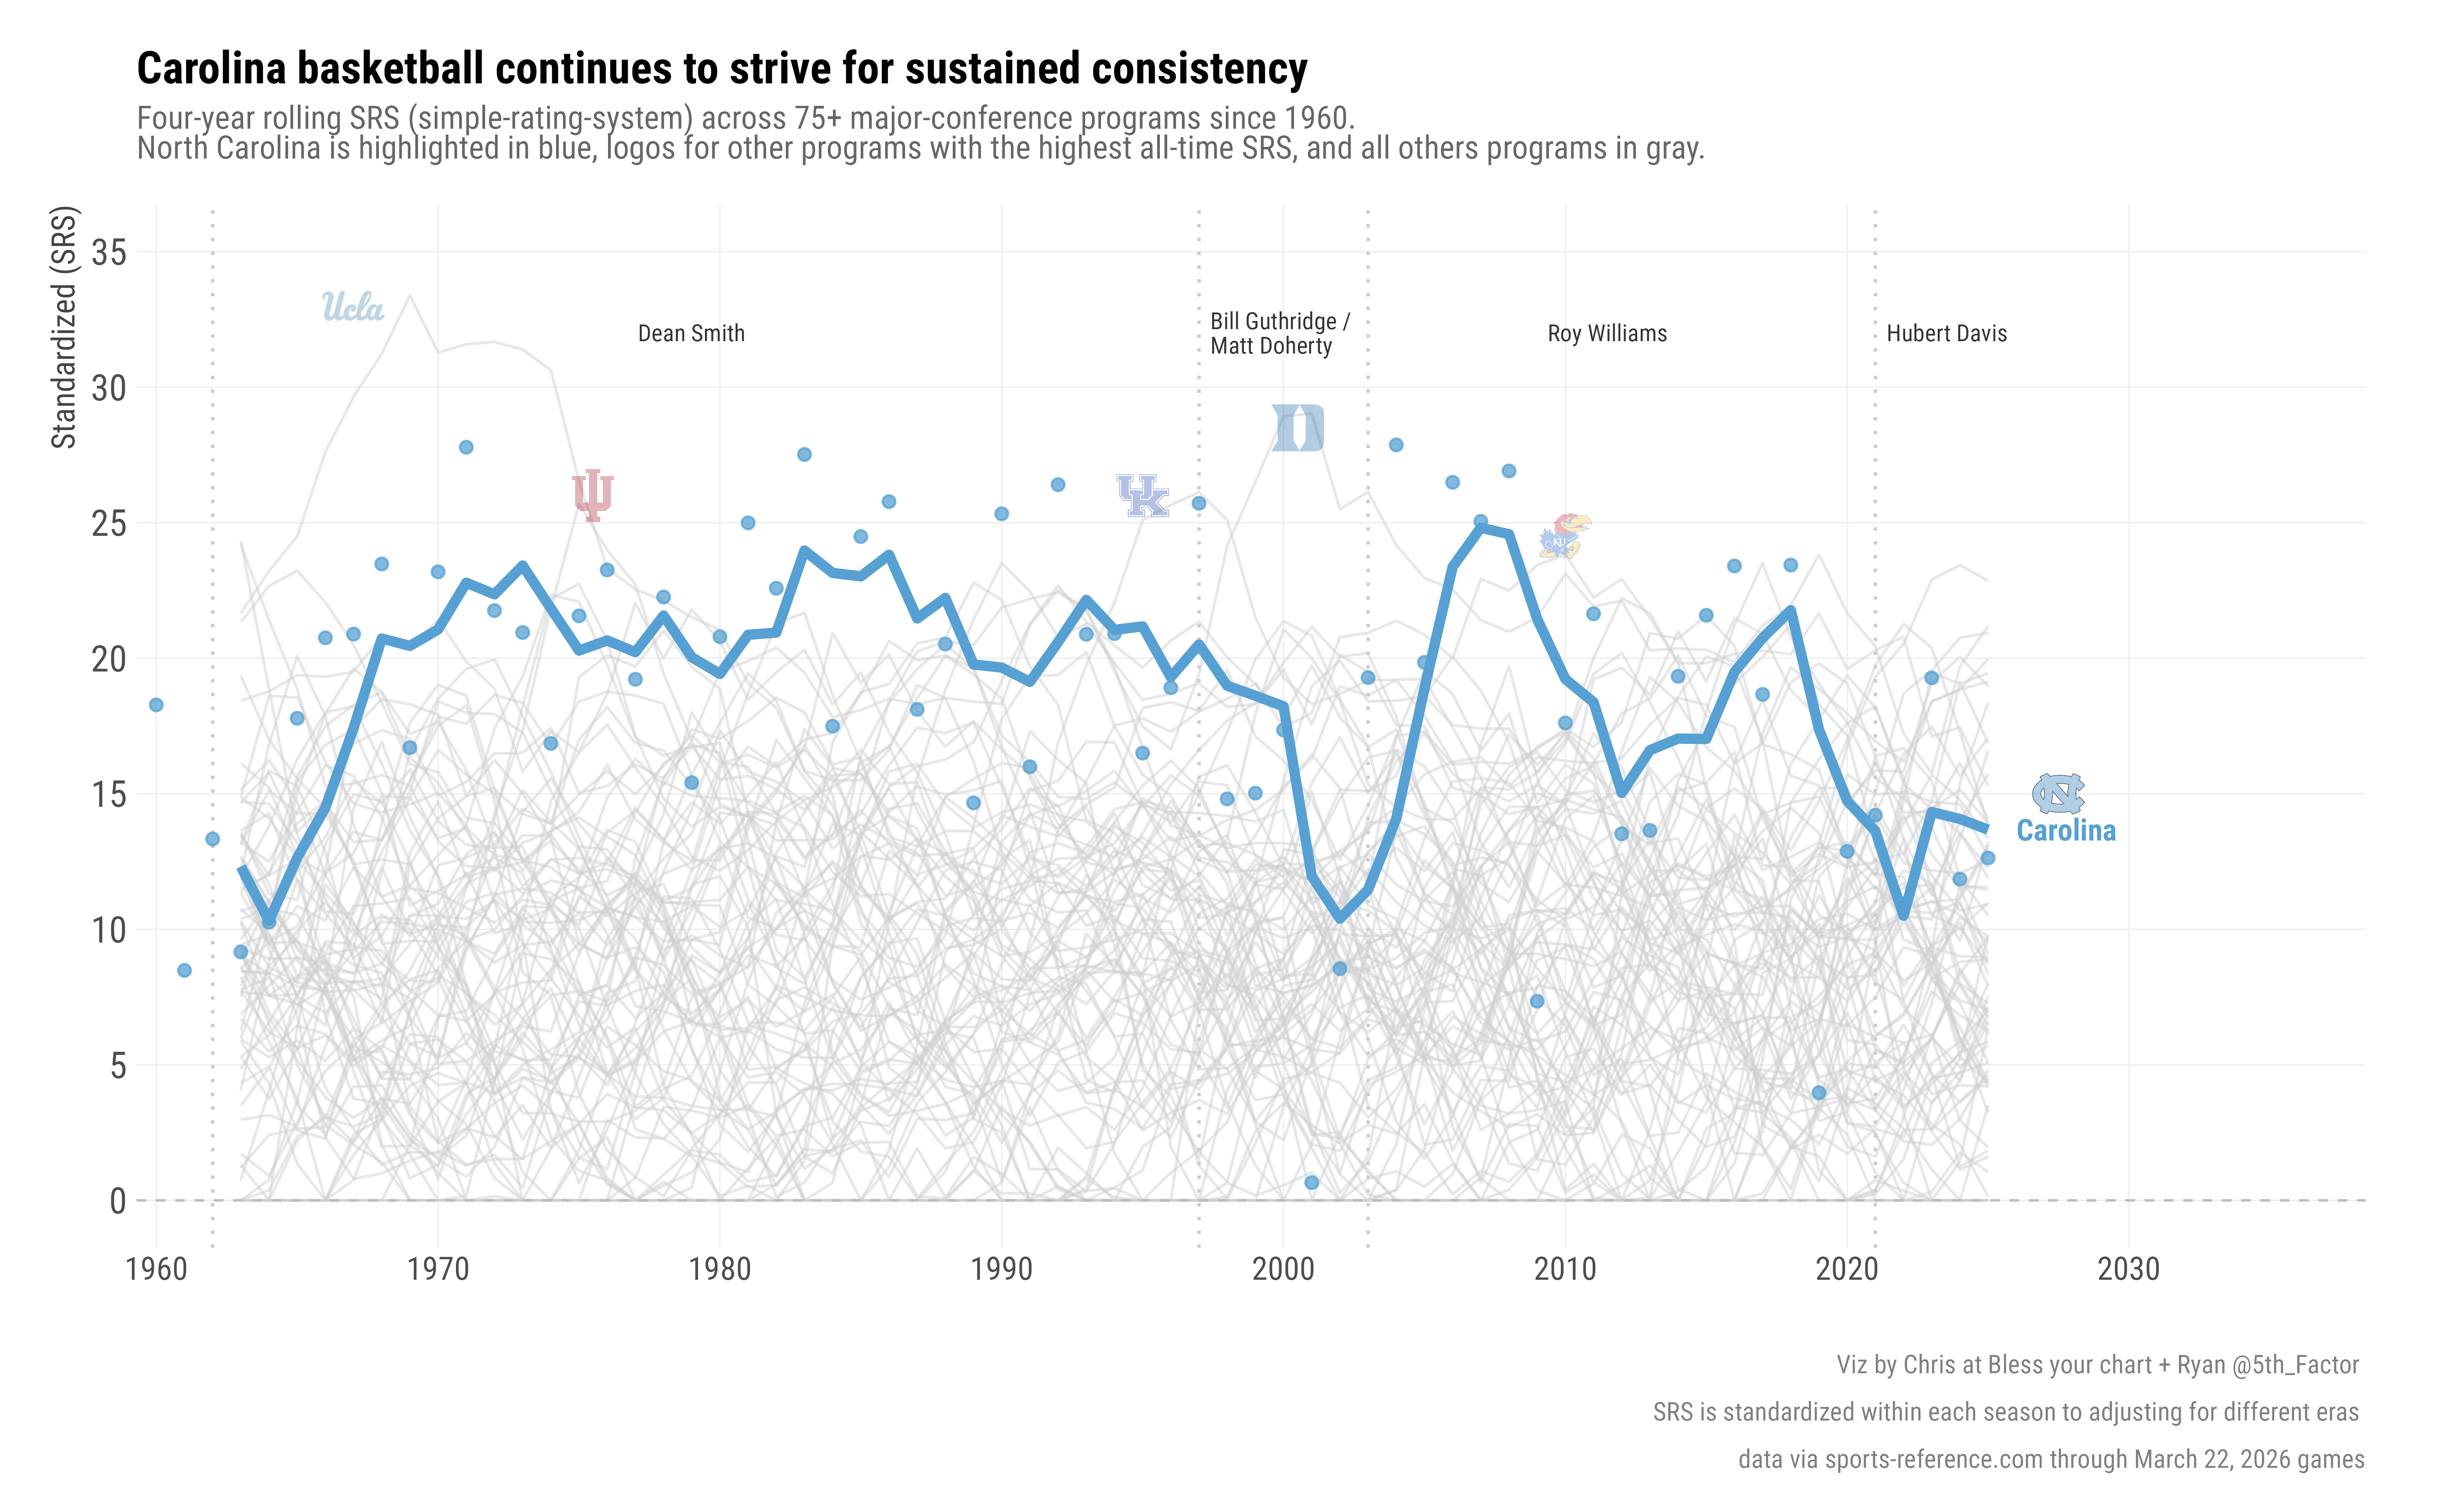
Carolina has peaks and valleys over 80-plus years, as you would expect. Those valleys drifted around an SRS of 10 in 2000, 2010, and 2020: coaching transitions, an academic scandal, and a global pandemic.
The peaks are why UNC sits in the top-five all-time in SRS out of 495 programs. From 1980 through the early 2000s, Carolina was consistently above 20 in SRS. That's the number that built the blue blood reputation. That's the standard people are referencing, even if they can't articulate it.
The March standard
Carolina basketball has played in more Final Fours (21) than any program in history. It defined success by winning in March.
If we zoom out post-Dean Smith, the program has won three national championships and made eight Final Fours since 1998. The seeds and those results tell a more specific story.
From 1998 to 2000, Carolina made two of those Final Fours under Bill Guthridge. The 1998 Final Four came as a No. 1 seed and the 2000 Final Four as an 8 seed. The 1999 Tar Heels were eliminated in the first round by Harold Arceneaux and 14 seed Weber State.
A three-year stint under Matt Doherty, included a 2 seed that ended in the Round of 32 and back-to-back missed NCAA Tournaments.
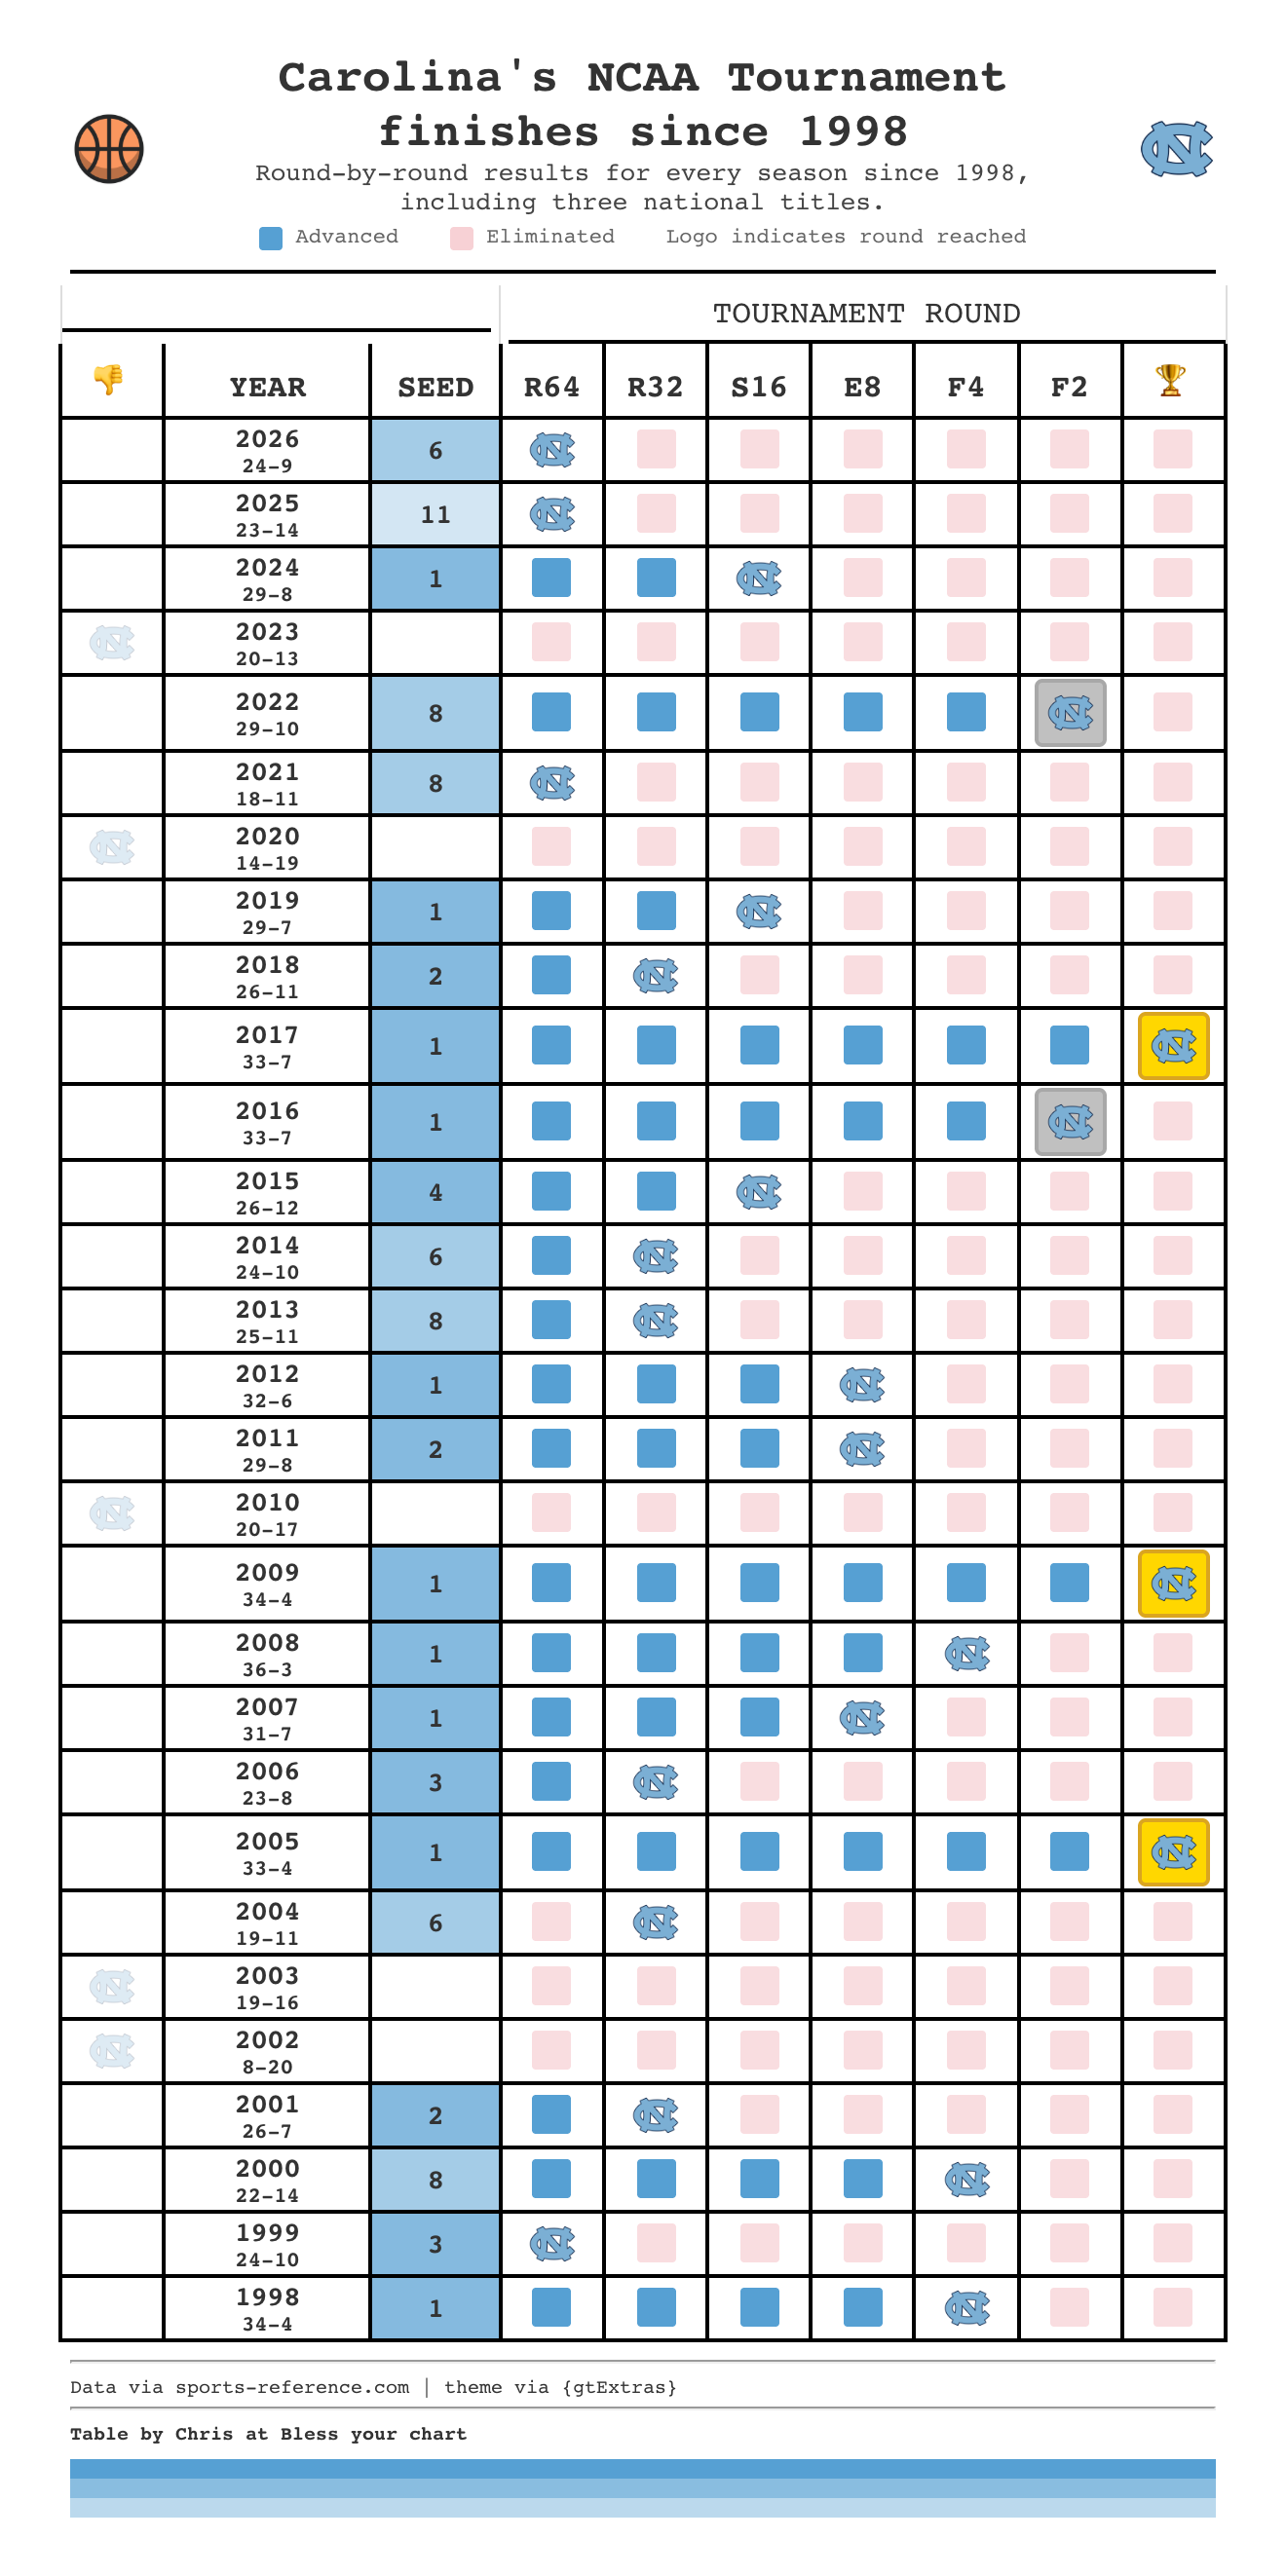
Under Williams, Carolina averaged a 2.7 seed and had eight No. 1 seeds across his 18 seasons as head coach. Missed tournaments were rare, and when they happened, they felt like anomalies because of the previous seasons of success. We even rationalize the 14-19 2019-20 campaign because the tournament was cancelled due to COVID.
The five seasons under Davis average out to a 6.5 seed. The résumé includes a runner-up finish in 2022, a missed tournament as the preseason No. 1 ranked team, a Sweet 16 exit as a 1-seed in 2024, and now back-to-back first-round losses. The 2022 run happened and no fan should want to give those games back, but the volatility around the past five seasons is real and it’s visible in the data.
The margins in a single-elimination tournament are razor thin. One game can define a season in either direction. But five seasons is enough of a sample to see a pattern, and the pattern shows a deviation from what came before it.
The identity standard
A chief criticism of the Davis era, and the one that’s harder to quantify, is the lack of a recognizable identity.
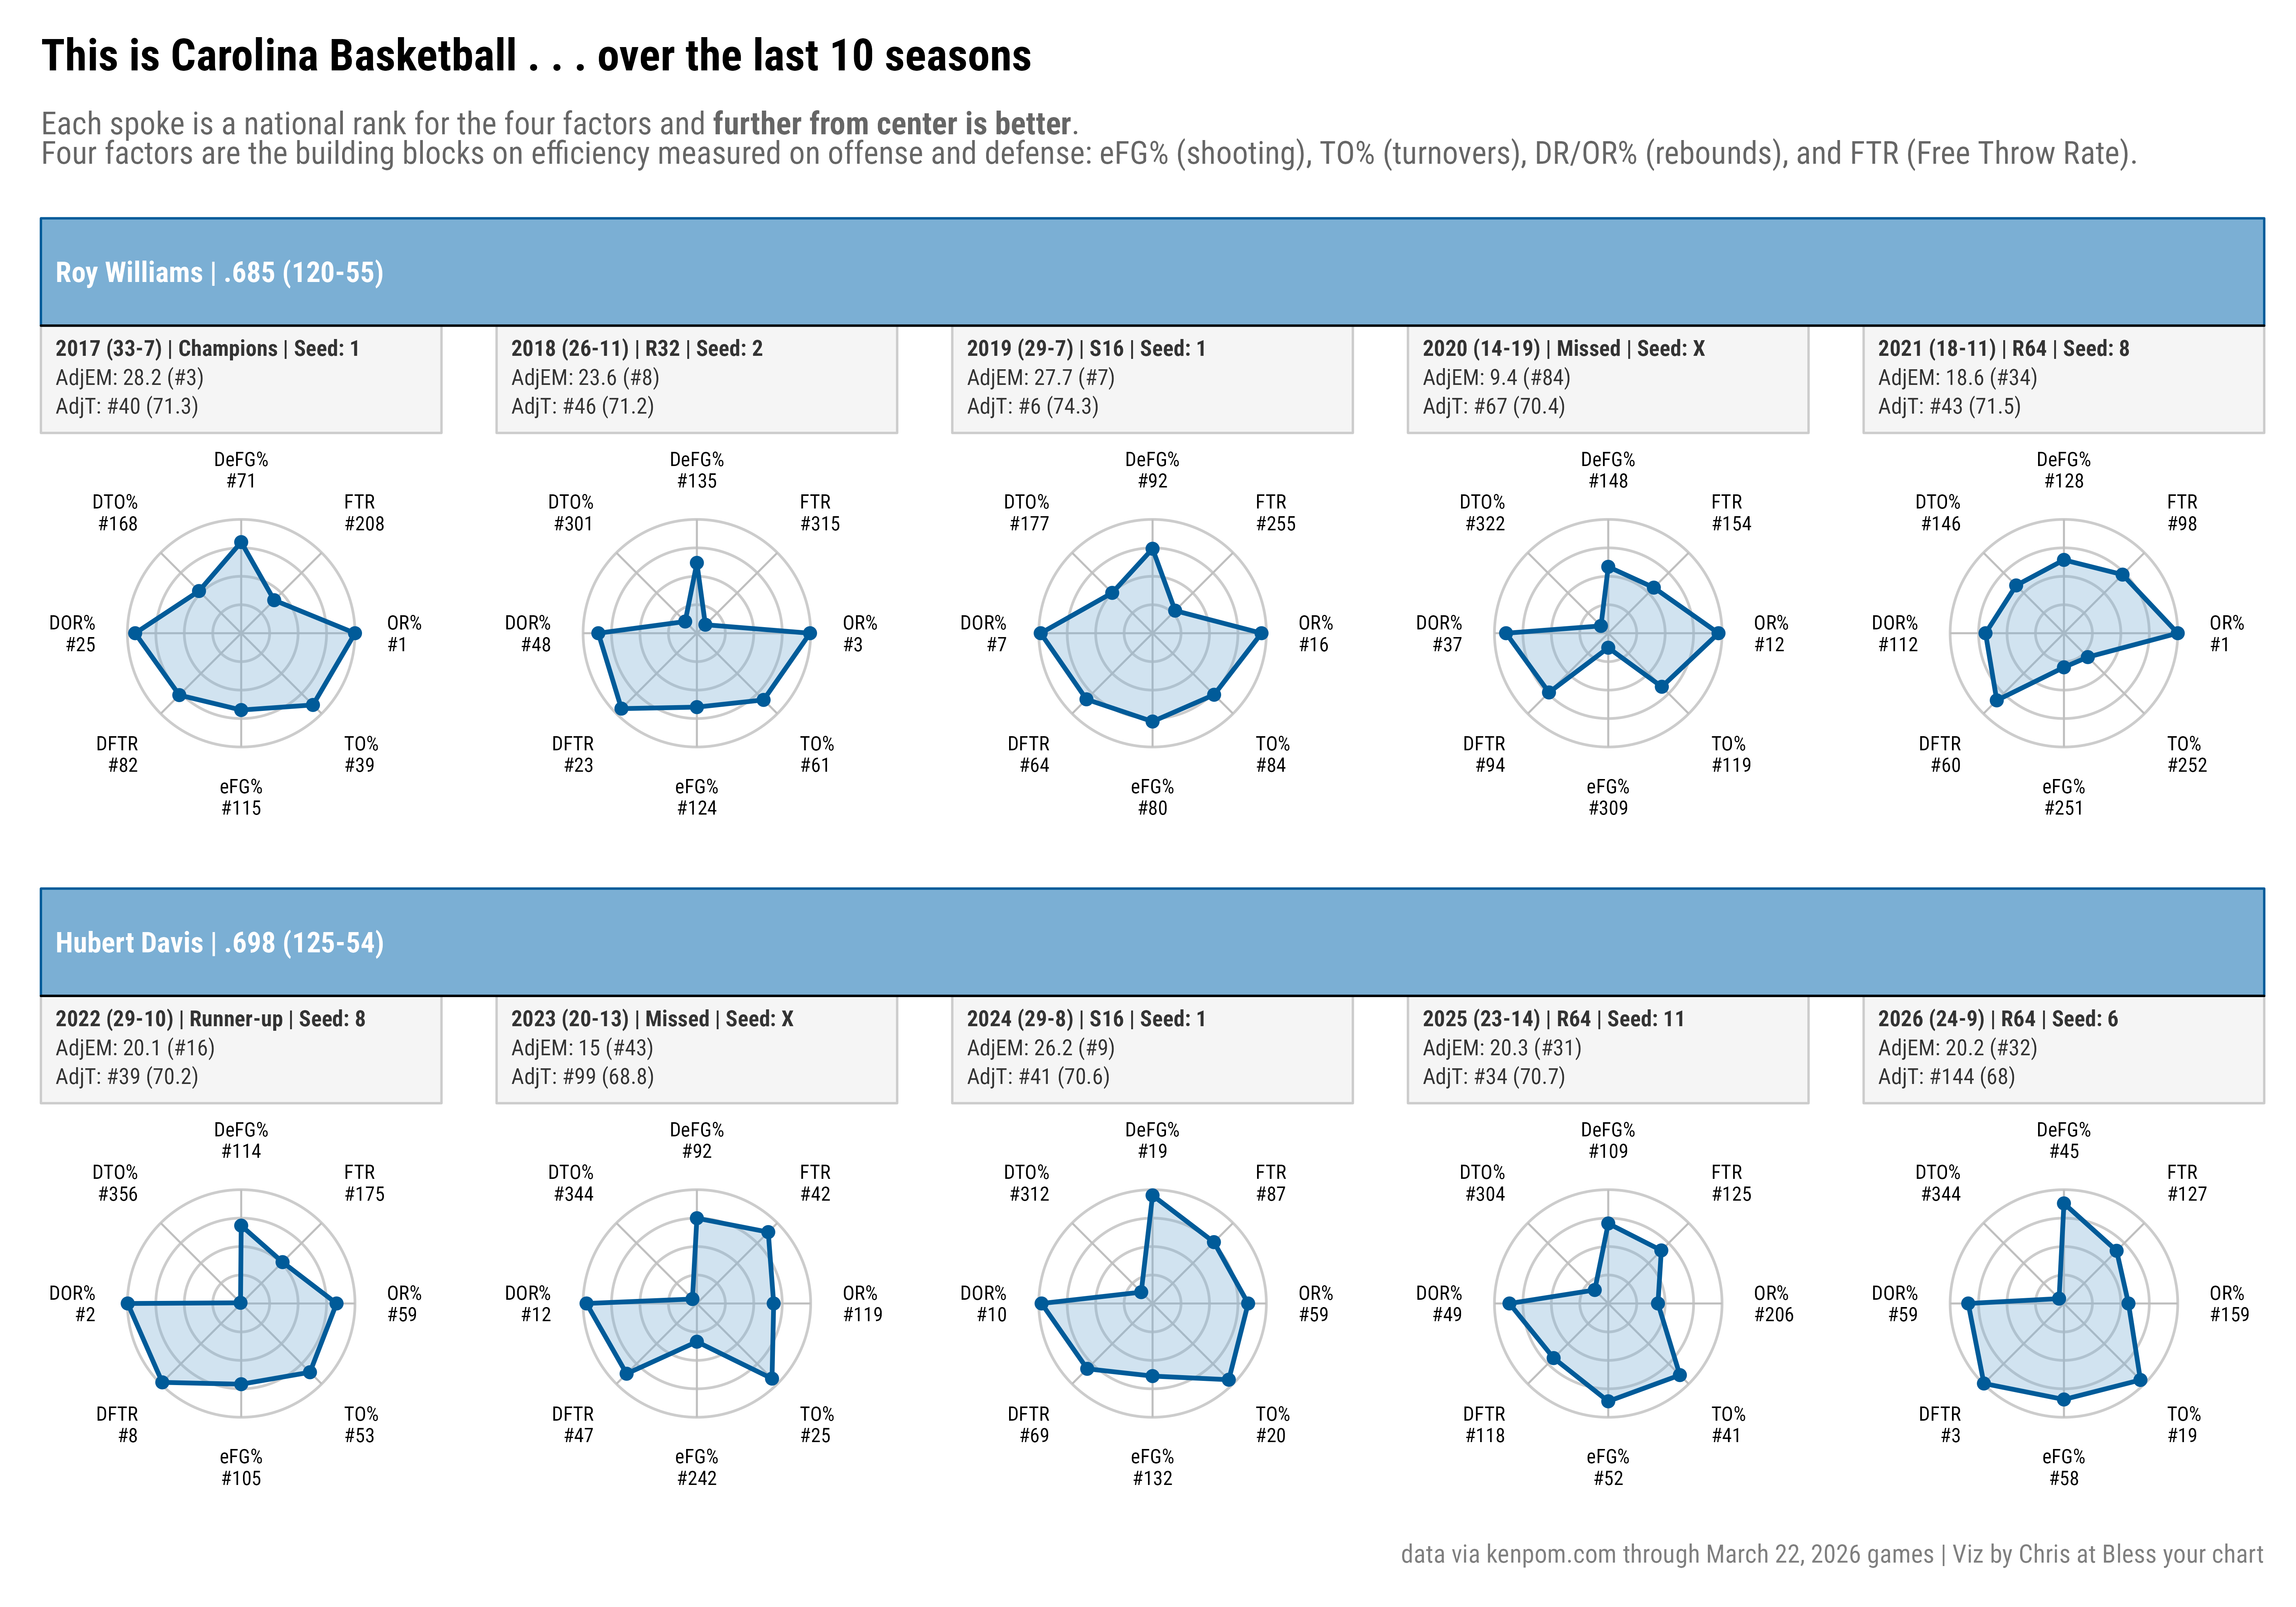
A Roy Williams team had a distinct profile. Relentless offensive rebounding and a fast pace. His teams weren’t always elite defensively, but they didn’t need to be. The 2017 title run is a good example, Carolina shot worse than three of its six NCAA Tournament opponents and still cut down the nets.
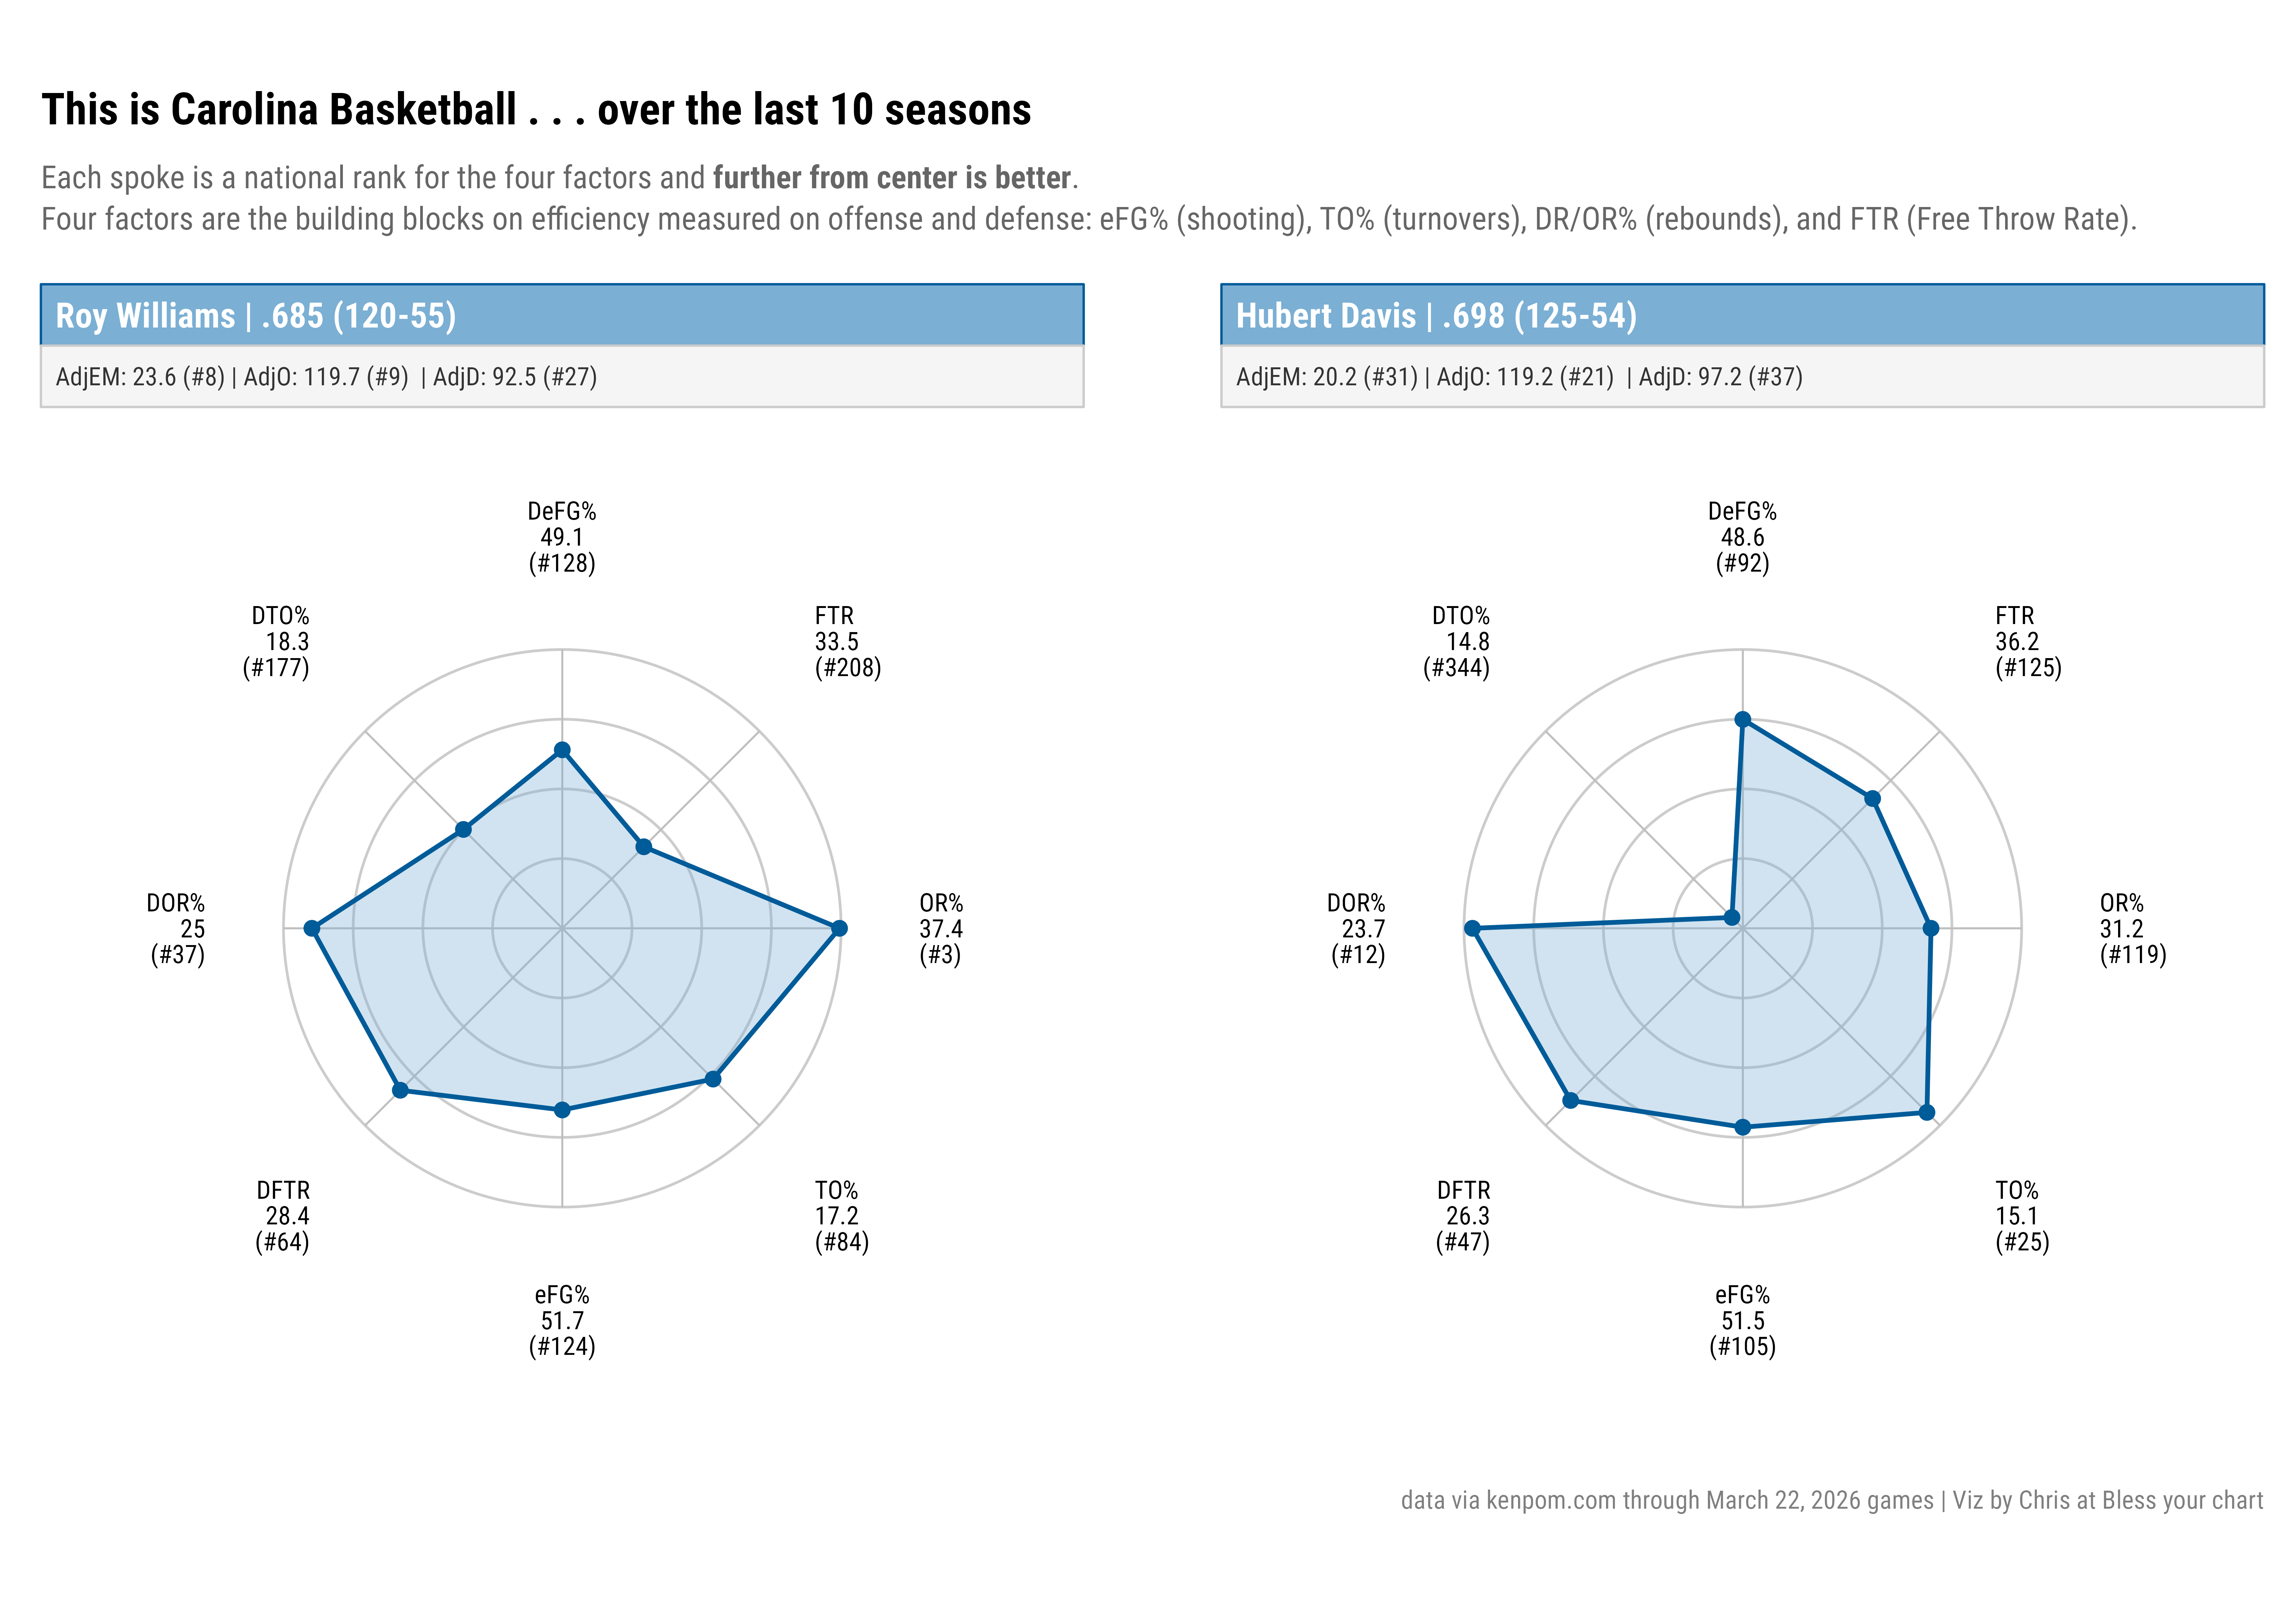
If the four factors are the building blocks of efficiency, we can try to use these to identify a team’s style under each coach. Of course, there have been rule changes that make the comparison tricky, so let’s only use the last 10 seasons.
The radar charts below show the median rank across the four factors on both offense and defense. A perfect circle would mean a team has perfect ranks in every factor.
What we forget is the last two seasons under Williams, Carolina was just two games above .500 (32-30 overall). Davis took over and it was important to try something different, the previous results demanded it.
Davis’ teams avoid turnovers and show above-average offensive numbers. The extreme offensive rebounding strength for decades has become ordinary.
What’s replaced that extreme is a clear focus on a more conservative defensive approach with a defensive turnover rate at the bottom of all of Division-I over the past five seasons. That doesn’t mean bad defense, but it does mean more shots for opponents.
The program has an identity under Davis or any coach. It’s just not always familiar. And when the results don’t compensate for the difference in style, it leaves everyone questioning the identity.
Meanwhile, in the current NCAA Tournament
The first weekend of the 2026 NCAA Tournament is complete. It was a wonderful, dramatic weekend of basketball.
The average seed of the remaining 16 teams is 3.8, which is a tick above last season’s 3.4 average seed in the Sweet 16.
Here is a breakdown of the remaining teams left by seed:
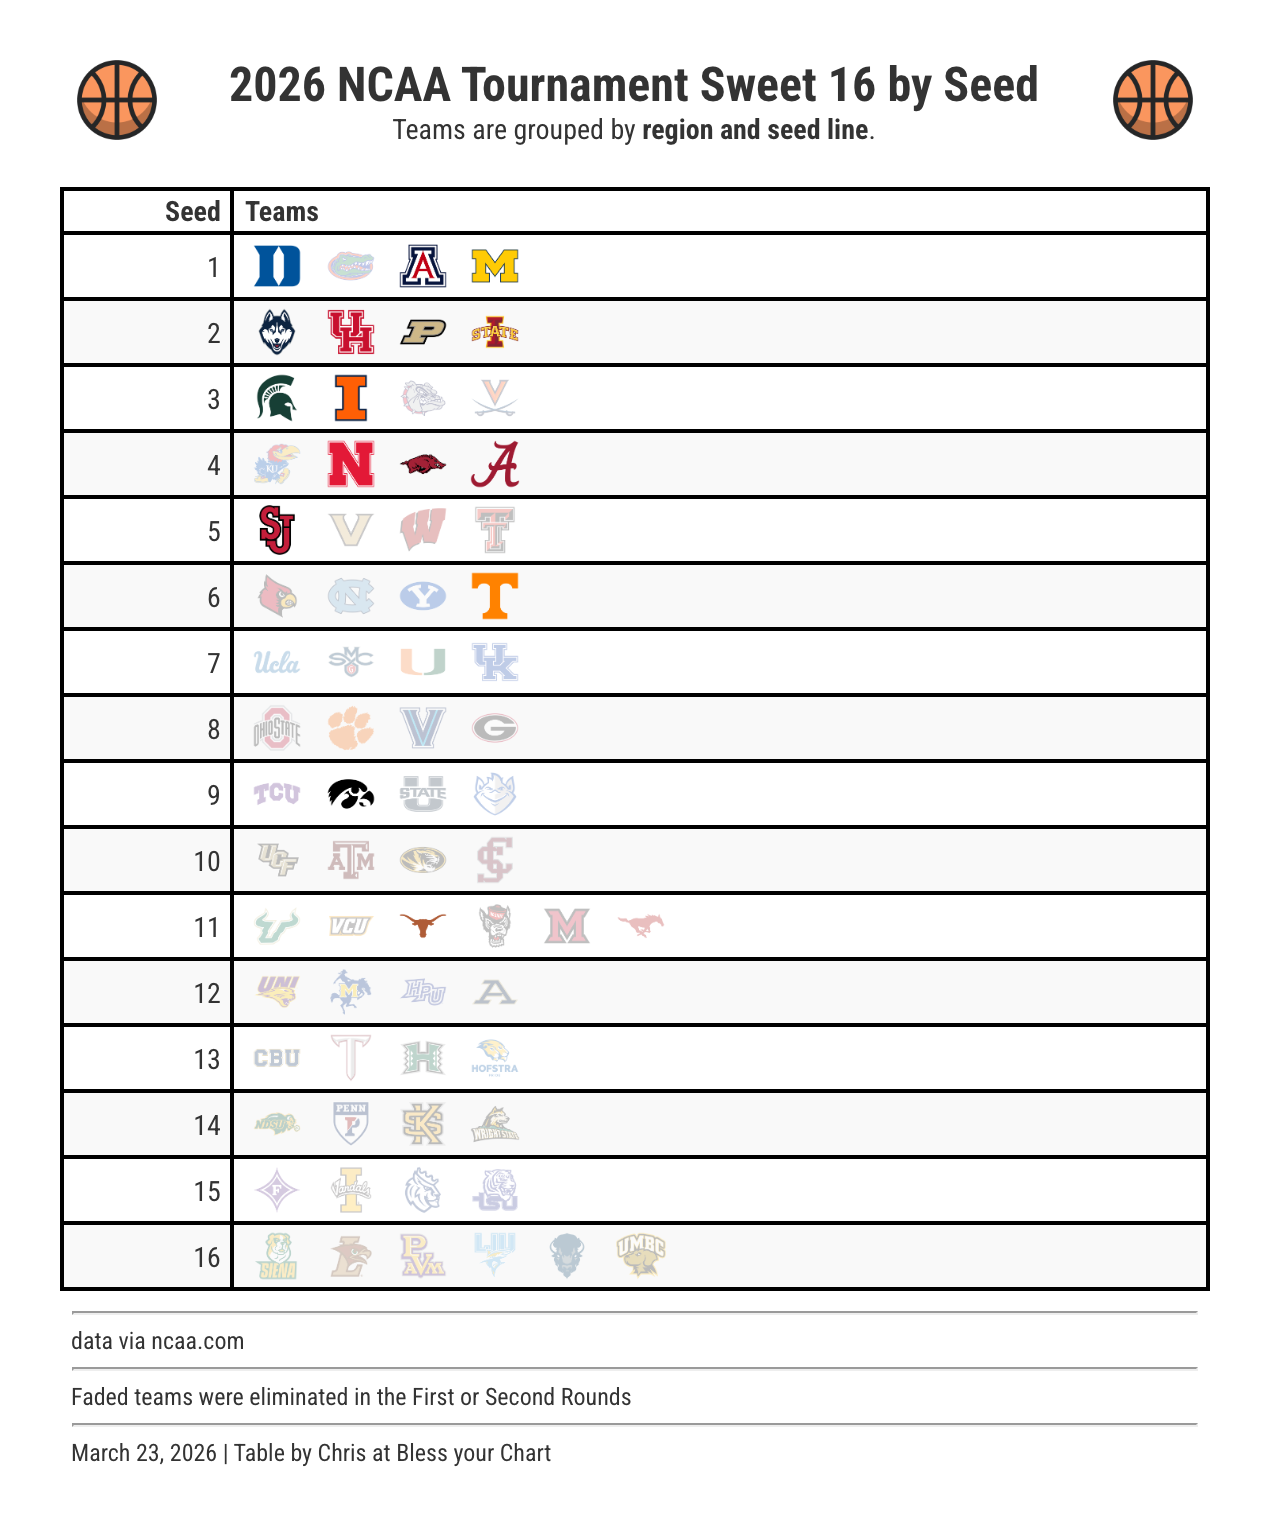
Last week, we wrote about this tournament feeling more predictable than ever, and the first weekend brought a lot of chalk. It was also a good reminder that single-game elimination can still deliver some chaos.
The defending champions got sent home by a 9 seed. The No. 1 overall seed trailed by double digits against a 16 seed at halftime. The sixth-largest comeback in tournament history happened too, and changed the trajectory of one of the sport’s premier programs.
Carolina is in a position to dramatically change its future. There is a hunger to get back to the standard. And that standard is well-documented and at the same time abstract.
We can point to the data. The consistent SRS numbers, the high tournament seeds, and the most Final Four appearances in history. We can say that’s what we want back. But the truth is the standard means something different to everyone.
Whether the next era meets the standard, redefines it, or proves that the golden age was not an outlier is the only question left worth asking, and the answer looks different depending on who you ask.
Thanks for reading this far, and big thanks to Ryan Campbell who helped put together the charts and edit this post.
A recommendation this week is this article from the Sports Illustrated vault by Tim Crothers and the late Grant Wahl about Bill Guthridge’s retirement.
Enjoy the rest of the NCAA Tournament. I’m trying to keep a schedule and previous results at the home page of wabwatch.com, maybe you find that useful. 🤟
Great analysis! The "standard" is something that has been thrown around a lot lately, nice to actually see the math behind it.