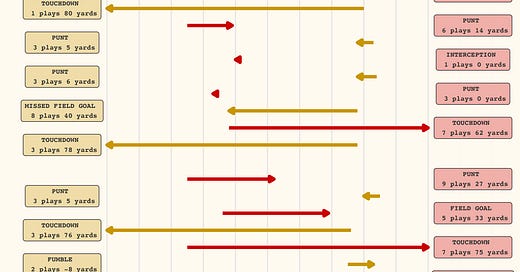
👋 I’ve been exploring how to visualize drive charts from college football games. For example, how can we take all this text or this text, and plot it on a graph?
Here is an attempt from a couple games over the past weekend, you can find the code for the charts here.
Notre Dame 45, NC State 24
Notre Dame beat NC State 45-24 on a stormy Saturday. The 45 points are the most the Wolfpack have given up since surrendering the same amount to Wake Forest on November 13, 2021.
Sam Hartman threw three touchdowns, and three interceptions, in that game for the Demon Deacons. Hartman threw four touchdowns for the Irish on Saturday.
The game itself was highlighted by a few pivotal drives. Trailing by a touchdown, the Wolfpack recovered a fumble and started a drive at the 17-yard line. The drive ended with a missed field goal.
NC State forced an Irish punt, and then proceeded to throw two interceptions in back-to-back possessions. Unlike the ‘Pack, the Irish capitalized on the short fields scoring touchdown drives of 33 yards and 16 yards.
Ballgame.
It was 29th consecutive regular season win against an ACC opponent for the Irish. Notre Dame is 42-9 against the league since 2014.
North Carolina 40, Appalachian State 34 (2OT)
North Carolina outlasted Appalachian State Saturday winning 40-34 in double overtime. Carolina overcame a pair of empty drives that ended inside the App State 30-yard line and lots of crucial penalties that led to three Mountaineer first downs.
On its opening drive, the Heels marched 61 yards over 11 plays. The possession ended on the App State 14-yard line after a failed fourth down attempt with its quarterback lined up as a wide receiver.
The Heels final drive of regulation ended with a missed field goal on a chance to win the game. The final seven seconds of regulation took about nine minutes of real time because of a official review, penalty, timeouts, and two shanked kicks.
The Mountaineers had a pair of trips inside the Carolina 30-yard line that resulted in just three total points too. A missed field goal on its opening drive proved to be costly as the game headed to overtime.
As college football fans, and human beings, we have a tendency to take the wrong things too seriously.
Since 2019, North Carolina has played Appalachian State three times. The Tar Heels are 2-1 in those three games, scoring 134 points to giving up 129 points.
UNC is 1-2 against the spread in those three games.
34-31 loss in Chapel Hill as a two-point favorite in 2019
63-61 win in Boone as a three-point underdog in 2022
40-34 overtime win in Chapel Hill as a 18-point favorite in 2023
The games have been pure entertainment.
Carolina trailed by as many as 17 points in 2019, and nearly came back to force overtime until Akeem Davis-Gaither blocked a 56-yard field goal attempt. In 2022, the Mountaineers scored 40 points in the fourth quarter. Forty points. There were eight lead changes Saturday before Carolina escaped with a double-overtime win.
These are games that fans should be encouraging the programs to play.
The thought that Carolina went down in the rankings because it played Appalachian State is lazy. Rankings that are descriptive, not prescriptive. Carolina covers the two-touchdown plus spread, it likely moves up in those same rankings.
Game duration + pace of play updates
Through 179 games, the average number plays per game for one team is 66.1. This is an average of 2.6 fewer plays compared to last season. The average game duration of three hours and 29 minutes is one minute longer than a season ago.
Week two featured at least 10 games that exceeded four hours of time due to weather. At this point, I’m including in the delays in the game durations because the historical numbers also include it.
You can follow along with all game durations here:
After a couple weeks of data, the number of drives appear to be consistent as well. Each game features an average of 12 drives for each team, which lines up with last season.
Last week when Chip Kelly complained about only having four drives in the first half, what if I told you UCLA had multiple halves last season with only four drives in a single half? In fact, it had only eight total drives in its loss to Oregon last season.
If you have questions or ideas on how to track game duration, please let me know.


